Next: Up: Case Studies Index Previous:2.0 UYS-2A Signal Processor Upgrade
![]()
![]()
![]()
![]()
Next:
Up: Case Studies Index
Previous:2.0 UYS-2A Signal Processor Upgrade
On the ETC for ALFS Sonar Signal Processor Program over fifty thousand lines of legacy software was converted into GEDAE™ data flow graphs in less than twelve weeks. Once in GEDAE™, the application can be easily ported to different hardware architectures without the need of graph modifications. For GEDAE™ supported hardware products, any application can be autocoded and optimized for execution on systems (single processor to multi-board) built using the vendors product. The visualization tools display all hardware and software activity on the target embedded system, including processing, interprocessor communications, and buffer activity enabling a level of optimization equivalent to or surpassing that achievable through hand coding. Mapping of the algorithm and optimization on the Mercury Computer DSP hardware took less than two weeks. This capability addresses the issue of software portability and application retargetability that is especially important for DoD applications. This gives >3X time improvement for real-time application development versus standard practice.
For truly embedded systems, the application can be controlled from a command program running on the embedded host. A tool known as the Application Interface Builder (AIB) was developed during this project that autocodes part of the command program. On this project the AIB software was used successfully to generate most of the command program. Of the 5800 source lines of code for the command program only 200 were generated by hand. After completion of the AIB tool, it took only a two weeks to code the command program and test integrated with the ETC4ALFS application both on the host/workstation and on the Mercury Computer target DSP hardware. This gives an 11X time improvement in command program development versus a normal hand generation.
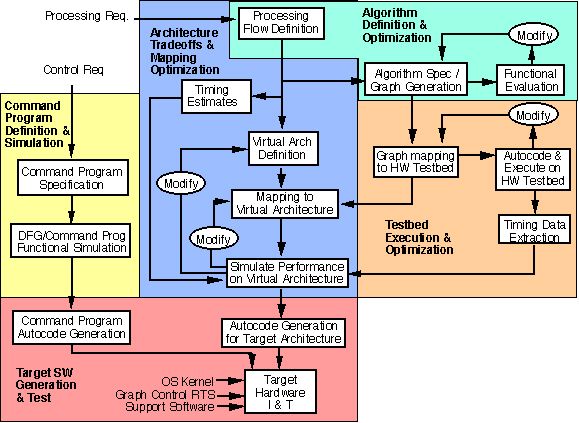
The RASSP design process used on the ETC4ALFS on COTS project is shown in Figure 3-1. This process is done in the GEDAE™ design environment. GEDAE™ is comprised of workstation development environment and target specific run-time kernels for embedded targets. The workstation development environment provides the capability required developing data flow graphs and validating their functionality. Included is support for mapping the data flow graph to multiple processors, autocode the application to run on those processors; and visualization of both individual and multiprocessor execution activity. The user environment is common to both workstation and embedded multiprocessor applications so is not necessary to switch tools when moving from algorithm development to the generation and optimization of code for embedded systems.
Capability is provided for the designer to partition the software representation for distribution and to map the partitions to multiple processors in an embedded system. The autocoding then generates schedules and code for each graph partition. Although the designer has flexibility in selecting the type of communication used (such as socket, DMA, or shared memory), implementation of the communication is automatic. Therefore, the application developer never needs to write any interprocessor communication software for multiprocessor implementations. In fact, this may be the greatest benefit of graph based programming for multiprocessors, since multiprocessor communication is responsible for most of the debugging problems for large applications.
For truly embedded systems, the application can be controlled from an external program independent from the development environment. A software API has been developed to facilitate this mode of operation. The command program software development (see Autocoding for DSP Control application note) used the application interface buider (AIB). The command program interfaces with the outside world via a messaging system and translates messages into graph and I/O control commands for execution by the run-time system.
Figure 3-1 Design process used on ETC4ALFS on COTS project
Algorithms are captured in GEDAE™ by placing processing function boxes extracted from a library on a work area and interconnecting them. The function boxes represent nodes or functions of the data flow graph. Designers create graphs by selecting from a large library of standard functions. Templates are provided to create new library primitives and new data types as needed. Custom primitives are created using standard C programming syntax.
For the ETC algorithm, the Navy delivered a set of laboratory C and Matlab code that had ~50,000 lines of code using a messaging backplane for data and parameter distribution with a large use of global variables. The code was migrated to GEDAE™ graphs by analyzing the c-code hierarchy with in-house tools and extracting core processing code and encapsulating the code into GEDAE™ custom primitives at highest level possible. Determine high load DSP functions, then parallelize and segmentize this signal-processing code for multiple DSP distribution using a combination of standard and custom GEDAE™ primitives. The capture, verification and optimization on the host of the ETC graph took 12 weeks this included one week of training on GEDAE™ tool for the personnel on the project.
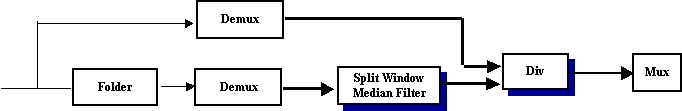
Figure 3-2 shows the coded pulse normalization data flow graph of the ETC4ALFS algorithm. This is the least complicated of the nine sub-graphs which make up ETC graph. Parallelism is succinctly described in the graphs. A bold shadow surrounding a node or box indicates a family (or replication) of functions, inputs or outputs. A double line between nodes indicates a family of interconnects. The algebraic description of graphs via parameterized families and routing enables automatic graph restructuring to support parallelism.
Figure 3-2 Coded pulse normalization data flow
A pure data flow graph architecture is greatly simplified if all the input data elements to a node can be processed the same way. However, in a general signal-processing problem the processing of data packets depends upon their position in the data stream. Usually the first and last packets of a data stream have to be augmented by additional data. For example: when running a FIR filter on a data stream, the filter must be initialized and terminated properly. In the GEDAE™ graph below this is done in the vector fold box (v_fold0vr1_m).
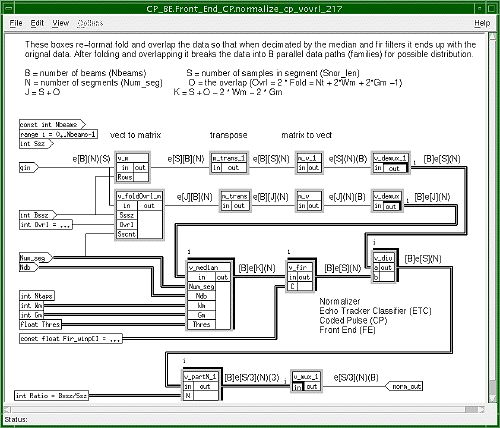
In Figure 3-3, normalization graph generated using GEDAE™, the data is brought in as qin vector and converted to a set of vectors of S sample length and there are B (number of beams) of these vectors per segment (slice) and there are N slices per ping. The upper path consisting of nodes m_trans_1, m_v_1 and v_demux_1 represents this rearrangement and movement of the input data set into parallel sets of data.
A parallel path generates the same data sets but augments the data by an overlap amount due to the action of the folder (v_fold0vr1_m) so that the Median (v_median) and FIR (v_fir) filtering operations can be performed in slices. The upper data stream is divided by the results of the filtering operation to perform the normalization. The vector length is divided to have a stream formatted as required by the next portion of the graph. Merging (v_mux_l) the data completes the processing.
Figure 3-3 Normalization GEDAE™ graph
Execution of data flow graphs is controlled through the same interface used to construct the graphs. There are several ways to observe the execution of a graph from both a hardware and software perspectives. There are dynamic displays that let users see what is occurring while the graph is executing, and static displays that collect detailed information in the background for subsequent analysis.
With the execution display enabled, the title bars of the boxes in the graph are highlighted when the functions execute. Hierarchical boxes in the graph are highlighted when any of the underlying boxes in the hierarchy are executing. With the queue display enabled, the status of the input and output queues are shown for each box in the graph during execution. A white label on an input or output indicates that the queue is empty, yellow indicates partially full and gray indicates that the queue is full. This same execution information can be viewed in a flattened table by viewing the Box Table and the Data Table. The Box Table shows the relative execution time of each function. It also displays the total time each box has fired, the average time for each execution, the number of firings, and the number of times execution has failed. The Data Table displays the state of all the input and output data queues in the graph. In addition, the Data Table displays the total time taken to transfer data into each input queue and the last sample number loaded into a queue.
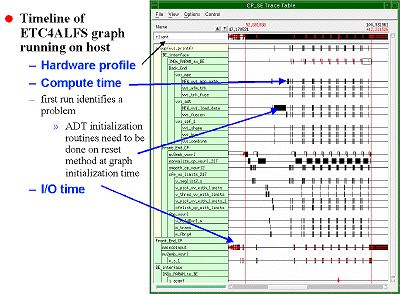
Data flow information can also be gathered in a non-intrusive fashion. Event timing data can be collected in the background while a graph is executing and the information stored until the Trace Table display is requested by the developer. The Trace Table, shown in Figure 3-4, contains detailed time line information of the ETC graph running on the host. This particular table is the first run of the full ETC graph on the host and showed a problem with one the primitives initialization methods.
Figure 3-4 Trace Table of ETC4ALFS Running on Host
Once the data flow graph has been verified and a partitioning and mapping scheme for the data flow graph has been determined, GEDAE™ constructs an execution schedule and generates the code for each of the processors in the system based on the partitioning and mapping. Each schedule specifies a sequence of functions to be executed sequentially. The schedule generation process maximizes the use of static scheduling to minimize overhead, but preserves dynamic behavior where required. A schedule may be divided into multiple sub-schedules which may all operate at different firing granularity to optimize performance. The GEDAE™ generated code is then automatically compiled, linked, loaded and executed on the embedded hardware. The library functions used to construct the graph are linked to the optimized math library provided by the hardware vendor to achieve optimum performance.
The types of optimization which are supported for embedded execution include interactive partitioning and mapping, memory usage, communication mechanism selection for inter-partition links, schedule firing granularity, queue capacities, and scheduling options. The Group Control dialog is the interface to all of the optimization mechanisms, which give designers control over the optimization and execution characteristics of applications executing on target architectures. Utilization of the optimization facilities is not required for a graph to execute properly, but is provided to assist the designer in attaining optimized performance for the application.
The Trace Table produced time-line graphs from the simulation results that showed the history of task executions on all the processors. The graphs were useful in helping to visualize and understand the impact of mapping options that led the designer to modify, optimize, and ultimately verify the partitioning, allocation, and scheduling of the software tasks onto the hardware elements. The time-line graphs showed the times when a processor was idle due to data starvation or buffer saturation that helped isolate other resource contentions and bottlenecks. Plots of memory allocation as a function of time were also valuable in visualizing and balancing the extent of memory usage throughout the algorithm execution.
Truly embedded applications must be capable of execution independent of the resources of a computer workstation and display. To support this mode of operation, RASSP's GEDAE™ tool provides a software API that facilitates controlling graphs and their execution from other software such as a Command Program. The API provides a set of functions that may be called to start and stop graphs, set parameters, read and write data to the graph, and connect graphs to other graphs. These capabilities provide the ability to develop applications using the advanced analyses facilities of the GEDAE™ development environment with the capability to eventually divorce the application from that environment and control it from a Command Program for a completely embedded application.
The Command Program is typically a 'C' language program that executes on an embedded single board computer or possibly one of the processors on the DSP module. The Command Program architecture consists of four layers.
A tool known as the Application Interface Builder (AIB) was developed during this project that autocodes the ASI functions, which can then be integrated with EFSM and UI level source code to complete the Command Program. The programmer provides a small text file describing the mode/launch package association and parameter set filenames. The launch package corollary information from GEDAE™ is readable by AIB and provides a description of all queue and parameter names and their data types.
The ETC4ALFS on COTS program provided the opportunity to demonstrate AIB on a graph that had modes with multiple sub-modes. Although the ETC4ALFS on COTS application command program is ultimately intended to be embedded in a larger command and control program structure for ALFS, for the acceptance test the command program needed to be a simple stand-alone program. This provided the opportunity to extend the scope of code generation in AIB to the UI and EFSM layers. AIB was extended to generate a "generic" command program where the User Interface was textual and was composed of a collection of menus that allowed the selection of sub-mode and setting of all parameters visible to the command program. This generic command program proved to be sufficient, with minor tailoring, for the ETC4ALFS on COTS acceptance test. As can be seen from Table 3-1, ETC4ALFS on COTS Command Program Source Code, the combination of AIB generated ASI software and the AIB generated generic command program reduced the amount of handwritten software for the command program to less than 5%.
On this project the AIB software was used successfully to generate most of the command program. Of the 5800 source lines of code for the command program only 200 were generated by hand. After completion of the AIB tool, it took only a couple of weeks to code and test the command program integrated with the ETC4ALFS application both on the host/workstation and on the Mercury Computer target DSP hardware. A number of conclusions can be reached about the Application Specific Interface Builder (AIB) from RASSP's ETC4ALFS on COTS benchmark project:
3.0 ETC4ALFS on COTS Summary
To support the deployment of the software for the digital signal processor, RASSP developed autocoding technology to convert the architecture independent description of an algorithm into an architecture dependent set of software executables. GEDAE™ is one of the RASSP autocoding development environments that enable designers to capture signal-processing applications in a hardware-independent graphical representation, which designers can then partition and map the application to a variety of commercial multi-processor embedded hardware architectures. Once the application is partitioned and mapped to a selected architecture, the tool generates real-time software using target specific vendor supplied optimized libraries.
3.1 Design Process
3.2 Algorithm Definition and Optimization
3.3 Testbed Execution and Optimization
3.4 Command Program Definition and Simulation
Layer
Generation Tool
Lines of Code (approx) User Interface (UI)
AIB
1200
Execute Finite State Machine (EFSM)
hand
200 Execute Finite State Machine (EFSM)
AIB
200 Application Specific Interface (ASI)
AIB
3500 Command Program Interface (CPI)
GEDAE™
750
Table 3-1. ETC4ALFS on COTS Command Program Source Code
![]()
![]()
![]()
Next:
Up: Case Studies Index
Previous:UYS-2A Signal Processor Upgrade