Next: 5 Hardware / Software Codesign Process Applied to Mixed COTS / Custom Architecture Up: Appnotes Index Previous:3 RASSP Hardware / Software Codesign Process
![]()
![]()
![]()
![]()
Next: 5 Hardware / Software Codesign Process Applied to Mixed COTS / Custom Architecture
Up: Appnotes Index
Previous:3 RASSP Hardware / Software Codesign Process
4.0 Integrated Toolset Example for COTS Architecture
The discussion that follows describes the application of the integrated toolset to the Semi- Automated IMINT Processor (SAIP) application which was implemented as the RASSP Benchmark 4. This benchmark has been implemented using a fully COTS archtecture.
For details of the command program development on the Benchmark 4 effort, see the Benchmark 4 SAIP Case Study.
4.1 Data Processing by Slices
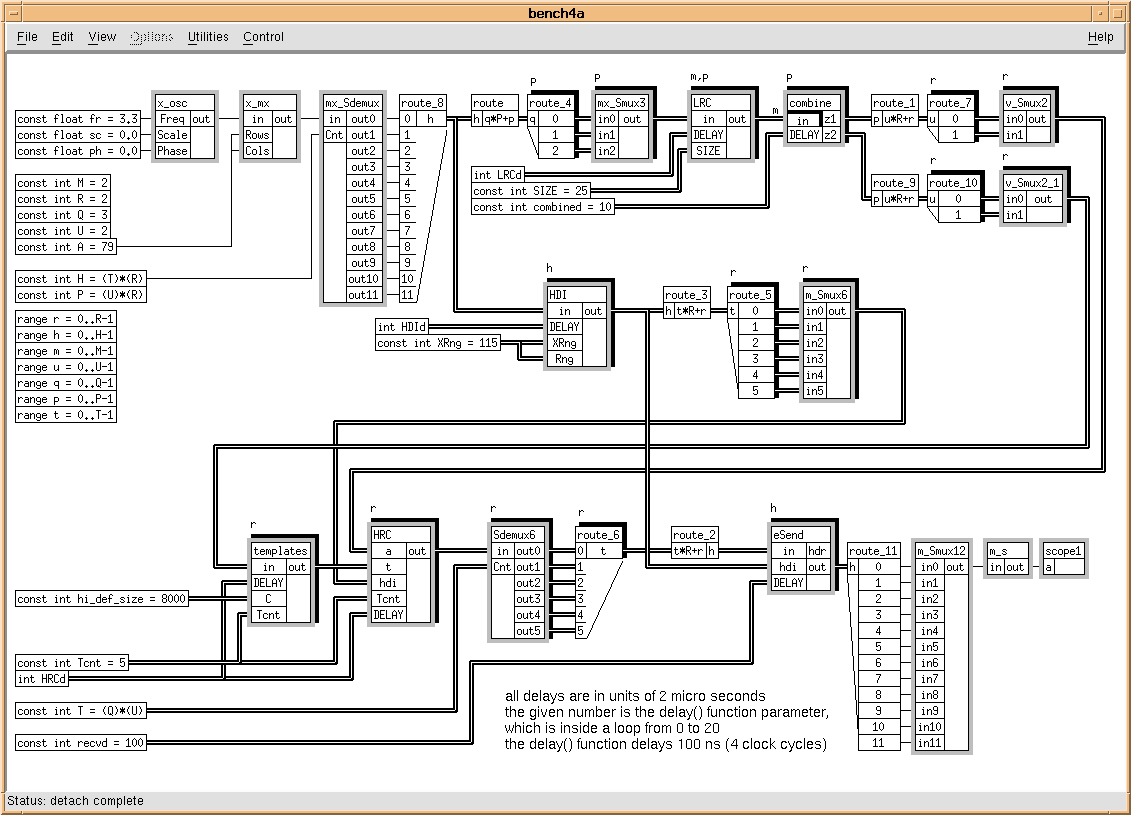
A data flow graph constructed for the SAIP application is shown in Figure 4 - 1. The graph contains all of the data flow required by the application but the processing which must be performed is represented with simple delays. There is no functionality contained within the processing functions referred to as HDI, LRC and HRC. The graph was constructed using the graphical editor of the GEDAE™ tool. This graph is executable within GEDAE™, but because the processing is modeled as simple delays, no computation is performed on the data, it is merely moved throughout the graph to represent the actual data flow required by the application.
4.2 Generating the hardware architecture
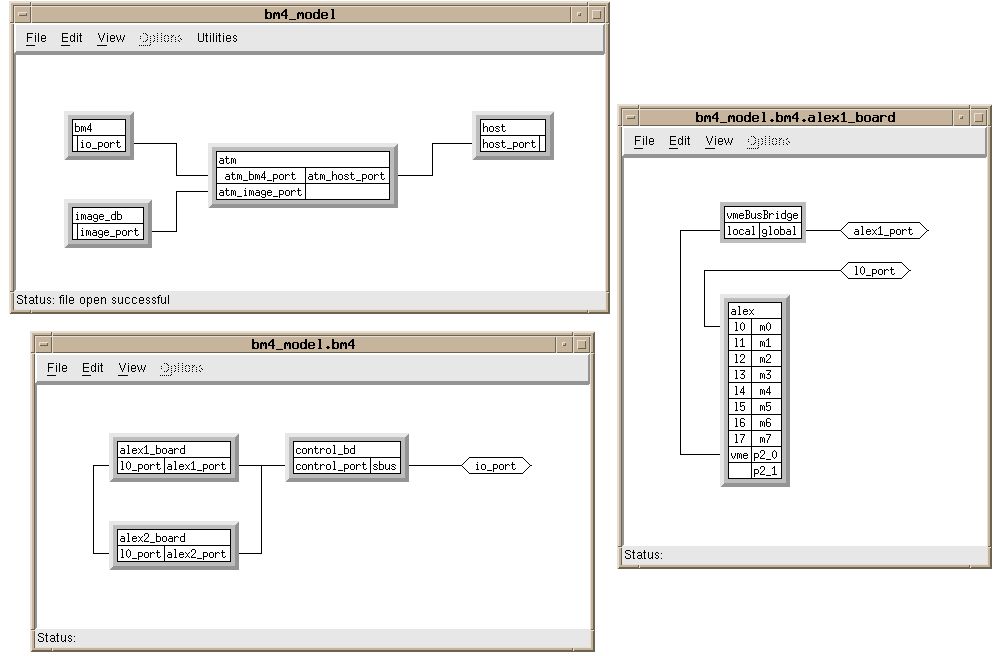
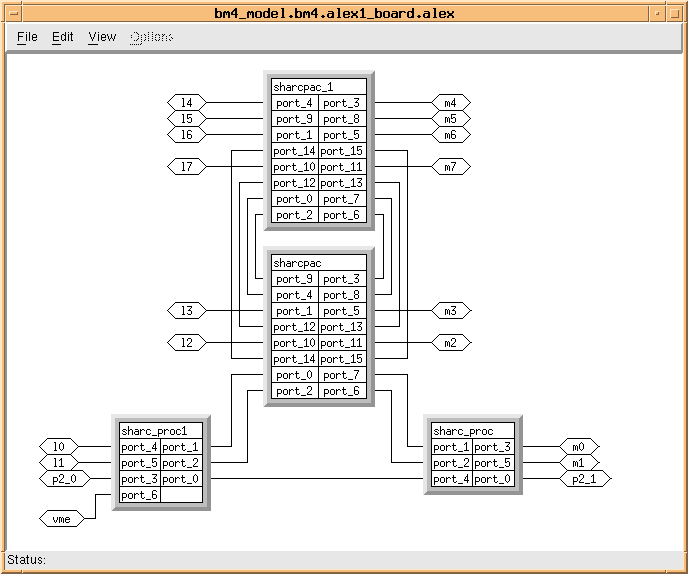
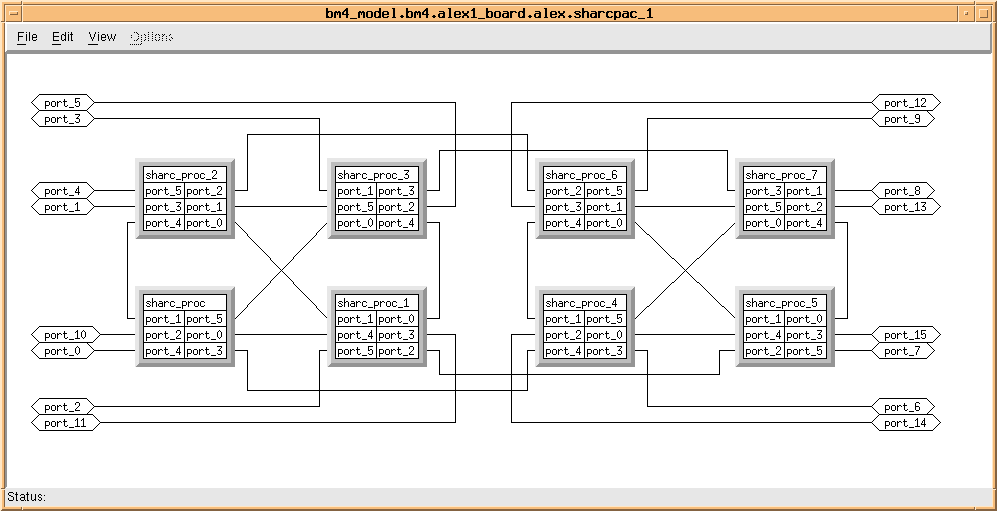
A portion of the hardware architecture for the SAIP application is shown in Figures 4 - 2 through 4 - 4. In Figure 4 - 2, the upper left window shows the top level architecture which consists of a host computer, ATM network, an image database, and the BM4 hardware. The lower left window is an expansion of the BM4 harware showing that it consists of a control board and two Alex boards (SHARC products from Alex Computer Systems). The expanded view of one of the Alex boards is shown in the right window of Figure 4 - 2 and is modeled as a VME bridge plus the remaining Alex hardware. Figure 4 - 3 shows the remaining Alex hardware modeled as two SHARC processors plus two SHARCPac daughterdcards. Finally, in Figure 4 - 4, one of the SHARCpacs is shown modeled as eight SHARC processors interconnected via SHARC links. The Alex board architecture utilizes only SHARC links for processor to processor communications, and all communication to/from the VME is through one of the SHARC processors on the motherboard. From these figures, it is seen that the architecture being modeled consists of two boards, each containing eighteen (18) SHARC processors. Four of these boards are required to meet the overall application throughput. All communication between processors is via the Sharc links. This two board partial architecture example was used to evaluate the mapping of the application to the individual processors on the board. The graphical, hierarchical description of the architecture shown in Figures 4 - 2 through 4 - 4 is generated using the GEDAE™ hardware editor and the individual elements correspond to architecture entitys in the COSMOS model library.
4.3 Architecture tradeoffs
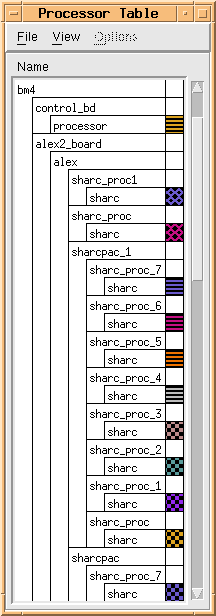
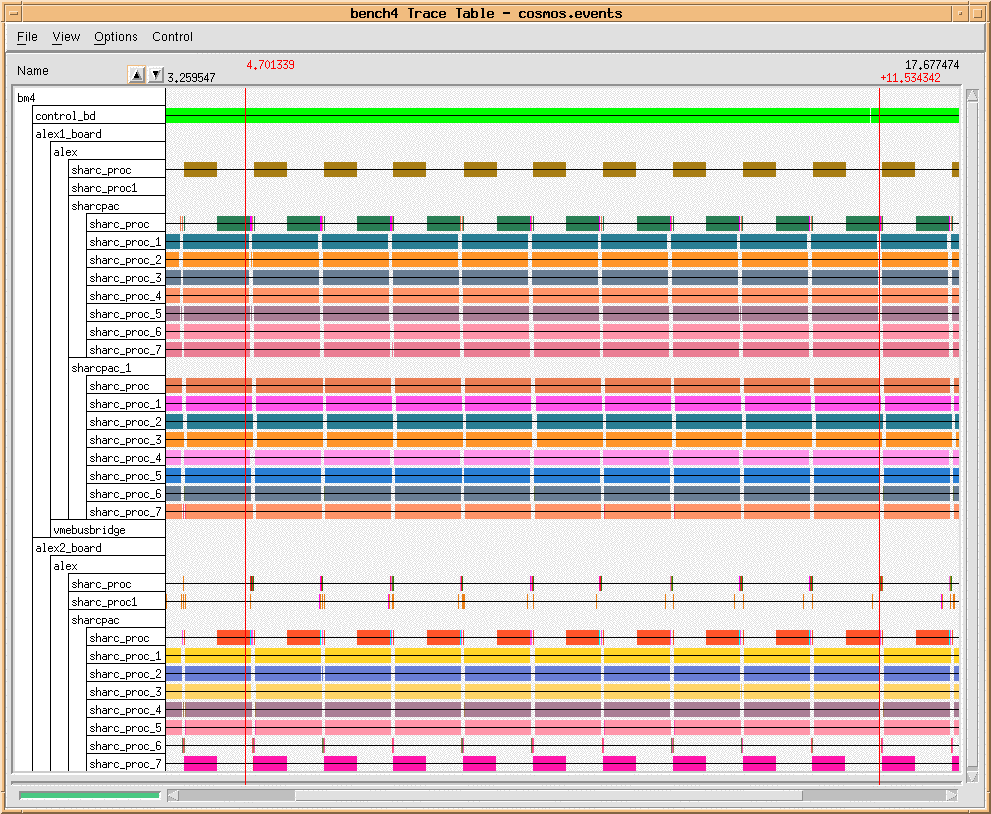
The application graph is mapped to the processors in the architecture using the GEDAE™ Processor Table shown in Figure 4 - 5. The Processor Table is automatically constructed from the graphcial description of the hardware architecture. The elements from which the architecture is constructed are the hardware models supported by the Cosmos tool which have been loaded into the GEDAE™ architecure element library. The nodes of the GEDAE™ software graph are mapped to the individual processors in the processor table using a drag and drop operation. When the mapping is complete, the software graph is translated to pseudocode which provides the stimulus for the Cosmos performance simulation. The hardware architecture is translated to a structural VHDL description, also for use by Cosmos. A control signal is passed to the Cosmos tool which then imports the hardware and software descriptions, generates and executes the VHDL simulation, collects performance event data, and translates the simulation data to the GEDAE™ Trace Table format. When complete, a control signal is passed to GEDAE™ indicating that the results are available. The resulting Trace Table is shown in Figure 4 - 6. The software, architecture, and mapping of the software to the architecture can all be iteratively optimized to achieve an acceptable solution.
4.4 Control software development
The major issue in command program source code development for the SAIP application was the development of the UI layer. Three options were considered:
The evaluation of these options began with a careful review of the executable specification (several C++ programs) provided by MIT/LL, since it contained the detailed requirements to be levied on the CP. The review concluded that reuse of a portion of the executable specification was the most technically sound, least risk and most cost effective approach. The executable specification was found to be well structured and contained a program that already performed all of the UI level functions. Significantly, this program was already integrated with the MIT/LL Test Bench Software. Due to the clean structure of the MIT/LL software it was determined that AIB generated ASI calls could be easily incorporated and that the modification required to interact with the graphs could be included without altering the Test Bench interfaces or the underlying Inter Processor Communication (IPC) software. The use of ObjectGEODE was rejected because the strengths of the tool were not well matched to this particular CP problem. One of the strengths of ObjectGEODE is managing communications among concurrent threads. In this case the concurrent threads would naturally be the command program, and the Test Bench processes. To use ObjectGEODE on only the CP program portion of the application would forfeit a major strength of the tool. A second ObjectGEODE forte is representing heavily state oriented applications, but in this case the EFSM layer was trivial so again the application was not well matched to ObjectGEODE. Since the MIT/LL provided software was a cleanly written, easily understood small program with a clean interface into the IPC software it was clear that there would be significantly lower labor costs and risks to modify this software than to rewrite it from scratch.
![]()
![]()
![]()
![]()
Next: 5 Hardware / Software Codesign Process Applied to Mixed COTS / Custom Architecture
Up: Appnotes Index
Previous:3 RASSP Hardware / Software Codesign Process