Next: 9 Conclusions Up: Appnotes Index Previous:7 Primitive Construction
![]()
![]()
![]()
![]()
Next: 9 Conclusions
Up: Appnotes Index
Previous:7 Primitive Construction
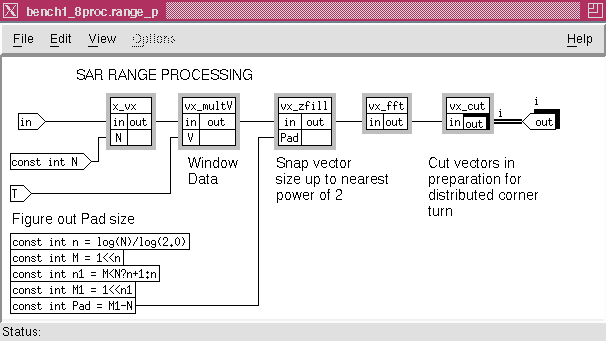
The subgraphs for the SAR range processing are shown in Figure 8 - 2.
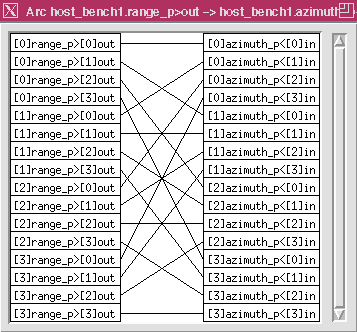
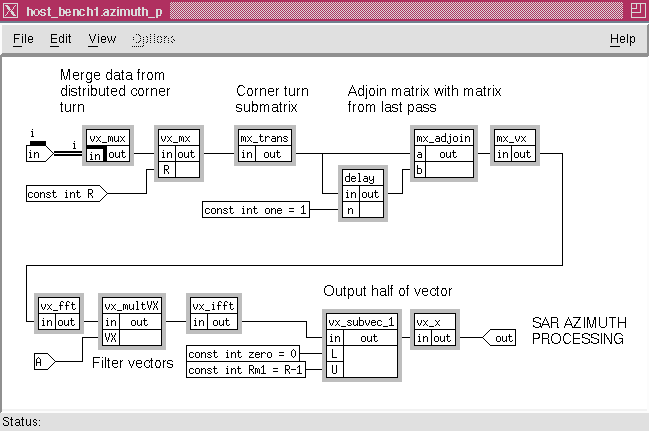
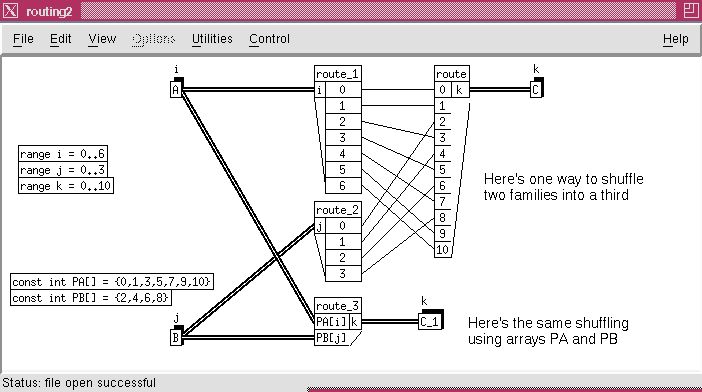
This shows that the data is first separated into Vectors by nodes x_vx and vx_multV and then filled by node vx_xfill to the FFT size. The output of the FFT computations is then segmented into vectors whose number correspond to the number of azimuth processors available. This operation is performed by the vx_cut node. Examination of the SAR algorithm shows that the corner turning processing of the data can be made efficient. Initially this processing was implemented by first collecting the data back into a stream and then corner turning the data after the whole family of range processing was completed. This process was changed so that as each column of range processing node is complete we distribute the data into a family of buffer queues. The number of queues match the number of azimuth processors. When the complete data set, consisting of all the columns that are needed for one of the families of the azimuth node and its corresponding queue is filled, the azimuth processing can begin. This procedure implements a distributed corner turning of the data. This corner turning implementation is readily expressed in a graphical form by using of index families of nodes and queues. The overall DF graph in Figure 8 - 1 shows that the range and azimuth processing which are families of dimension i and j respectively are connected by a family interconnect labeled i==j. This is the short hand notation used in GEDAE™ for a routing box. The routing box shown in Figure 8 - 3 is the expansion of the routing symbol on the main graph. Close examination of this figure shows how the i range j computation is routed to the j azimuth i computation. In effect, this operation block transposes the i row by j column range processing output to the j row and i column of the azimuth input. The data in the individual blocks is then transposed by including a transpose node operation in the azimuth processing graph before the azimuth processing takes place. This is shown in Figure 8 - 4 by the mx_transpose node.
The routing operation can be generalized and we may use graphical expression of tabular information in addition to using indices as described above. Figure 8 - 5 shows a comparison of the graphical and the tabular methods. The tabular method forms a table with the input index sequential and the output index is expressed as a function with the values as shown in the table. The indexing method used for the SAR example was made use of a simple index interchange. In other situations a more complex expression could be needed to express the input and output indices required and this is supported by the DF graph notation.
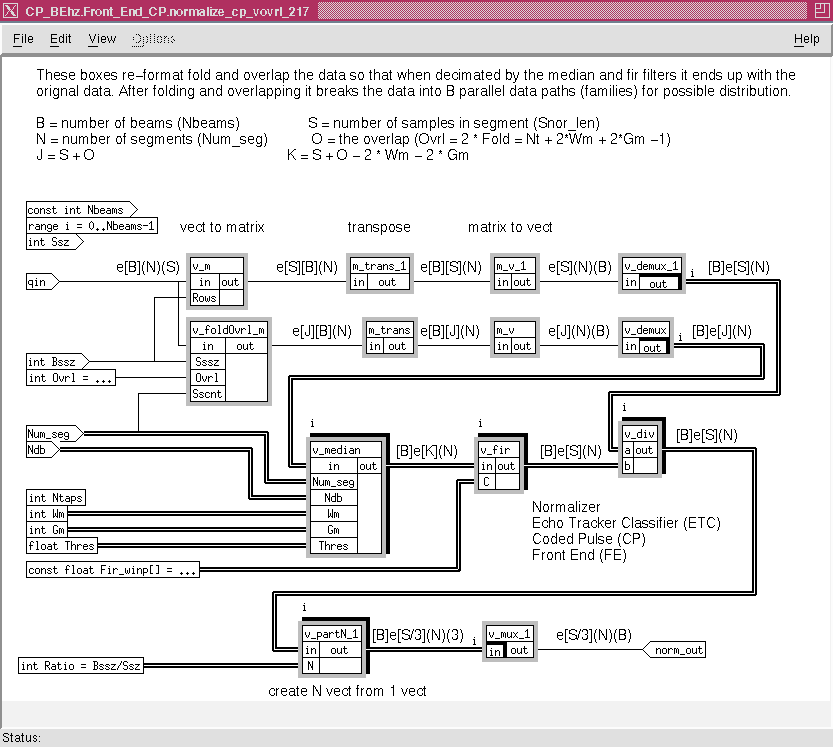
The first sub-graph, called the front end, is made up of a series of filtering operations upon the data called normalization and fine bearing estimation. These computations are terminated by a node that produces a data set that represents the clusters. Since the number of clusters produced for a given length of input data is dynamic, the V array is used to capture the clusters output from the CFE node. Each cluster consists of 54 data items and there could be from 0 to n clusters per slice. The number of clusters per slice depend upon the number of data items that exceed the threshold at the input of the CFE node.
Figure 8 - 7 shows the normalization or NORM processing. All the nodes shown are primitive nodes. The data is brought in as qin vector and converted to a set of vectors of S sample length and there are B (Nbeams) of these vectors per segment (slice) and the are N slices per ping. In this case S = 768 and B = 24. This rearrangement and movement of the input data set into 24 parallel 768 sets of data is represented by the upper path consisting of m_trans_1, m_v_1 and v_demux_1. A parallel path generates the same data sets but augments the data by an overlap amount due to the action of the folder, v_fold0vr1_m. The folder operates differently for each slice therefore the state counter repeat count of Num_seg is used to reset the counter at the end of each ping. The filtering operations of v_median and v_fir perform the NORM filtering and the upper data stream is divided by the results of the filtering operation to perform the normalization. In this graph the nodes that process the filter operations output vectors of length K which depends upon the parameters Wm, Gm and O. The processing is completed by merging that data in a v_mux_l operation. The vector length is also divided by 3 to 256 to have a stream of 256 x 24 set of data per slice as required by the next portion of the graph.
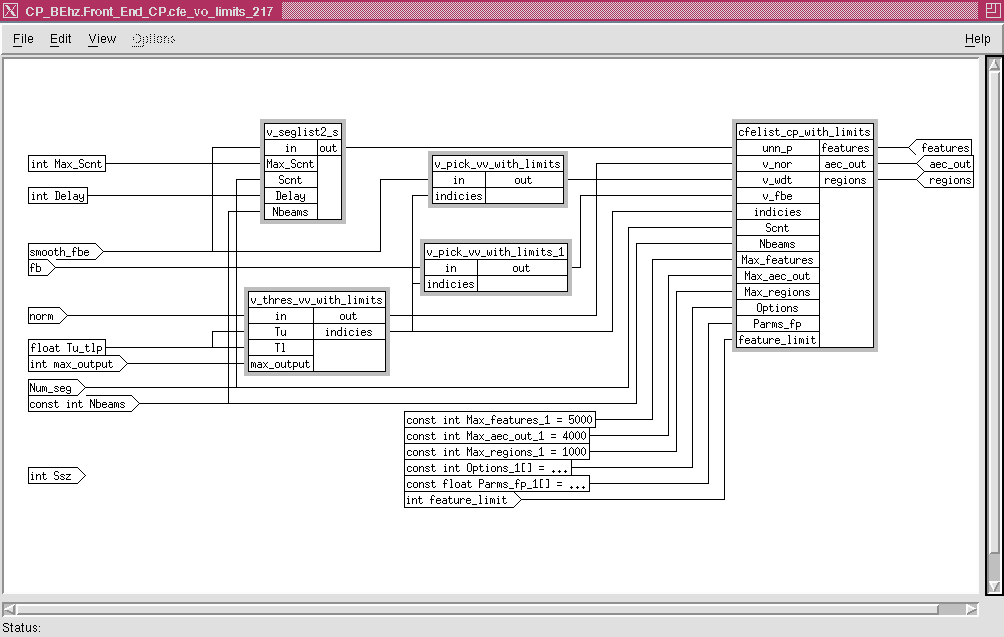
The CFE graph decomposes the vector data into V arrays and outputs a set of clusters of V arrays. These operations are shown in Figure 8 - 8. The input is one vector per slice and a V array is output by v_thres_vv_with_limits. The latter node thresholds the data at a level set by the parameter Tu_tlp. Therefore, the number of the values that exceeded the threshold depend on the data . The V array was used to contain the output of the threshold node Similar operations were performed by the v_pick_vv_with limits nodes. The last processing node was the cfelimt_cp_with_limits which inputs the V arrays and outputs a set of clusters in a V array per slice
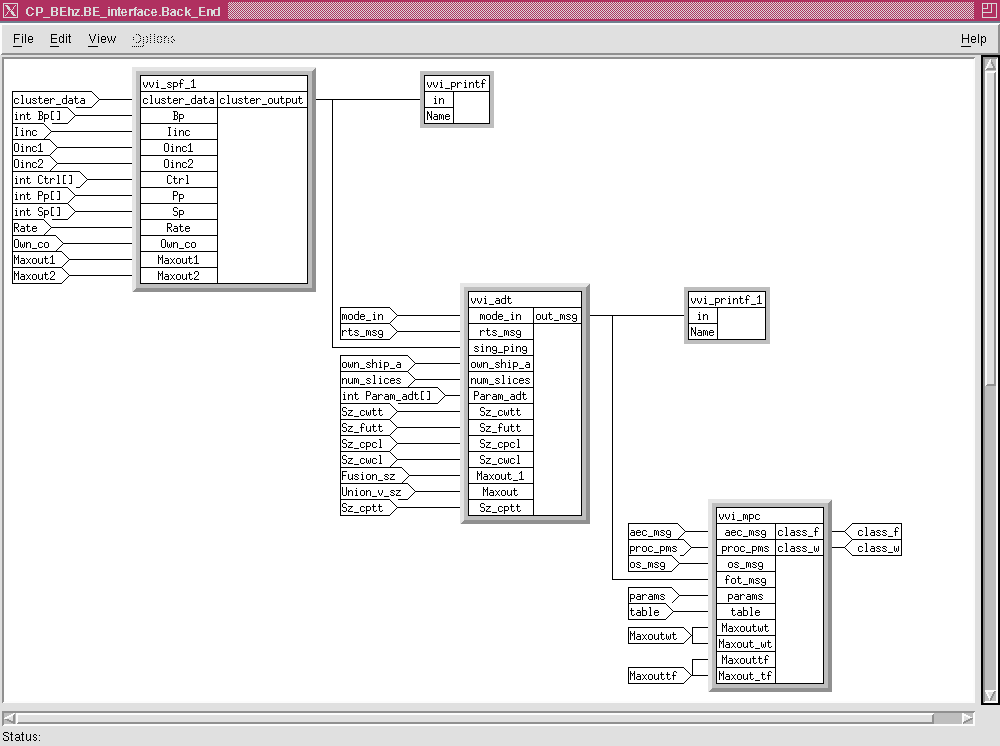
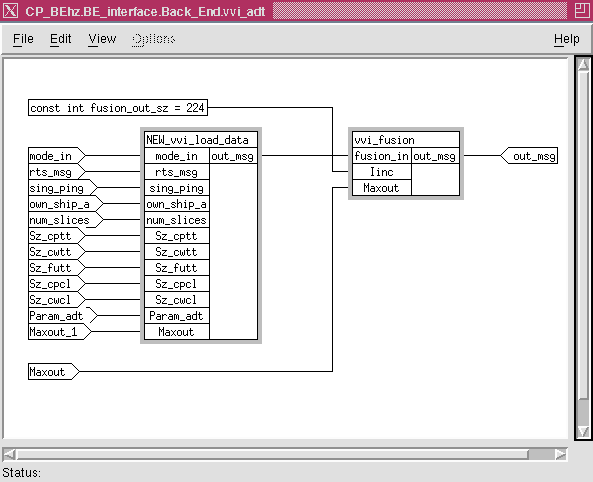
The processing called the back end, begins with the output of CFE and contains the processing of SPF, ADT and MPC. The cluster output of CFE is processed into tracks which are in the same form as the clusters data set. Each track is a data set of length 226 items with 0 to n tracks per slice. Again V arrays are used to transfer the data between the ADT computation node and MPC. The final output is a track report and there is a dynamic amount of track reports per slice depending on the number of valid tracks and a V array is used. The back end sub-graph is shown in Figure 8 - 9 and has a simpler overall graph topology since the graph uses V arrays for the inter element (SPF, ADT and MPC) transfers. At the lower level of the backend hierarchy is the individual sub-graphs for the three elements. Figure 8 - 10 shows the sub-graph for the ADT processing. This graph consists of two nodes. The Load-data node input is the clusters data in the form of a V array and other auxiliary data sets in the form of a vector or V arrays. One set is received for each slice. Functionally, the Load-data node puts all of the input data into global data structures and then passes a token to initiate the track processing. The expedient way to convert this code for DF operation was to mimic the way the original workstation version of the code operated. This DF architecture was used this way for the ADT process because the entire process was able to be run on one processor. There was no need to parallelize the operations in ADT in order to speed up its operation.
8.0 Selected Graph
In the previous section we have discussed portions of the graphs from the two implementation projects in order to illustrate some of the points associated with the design of a general DF graph. In this section we will review the complete graph for each problem and show how the final graph was implemented. The first graph, created for a SAR algorithm, illustrates of a class of projects that can be implemented using data flow graphs with out many extensions. The second example, shows how the data flow graph can be extended to handle a data processing algorithm. This project implemented a set of algorithms that are used to processes a Sonar pulse, produces clusters of data and then aggregates these clusters to produce a track. The figures shown throughout this section were generated using the GEDAE™ tool.
8.1 SAR Graph
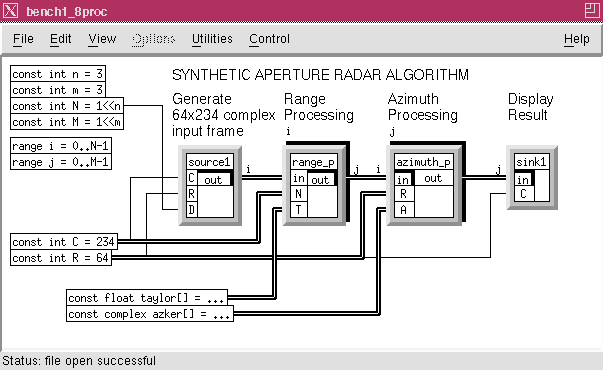
The SAR problem (see SAR Case Study) has been implemented using DF methodology. The SAR processing is divided up into two set of processes, the range and azimuth processing. The range processing is performed a column at a time and the number of columns processes by one node depend on the number of processors available. The number of range processing nodes are now grouped into a family whose size is selected by the number of processors available to perform the range processing. The azimuth or row processing is similarly divided into a family of nodes whose size is the number of azimuth processors used. This family notation is illustrated in Figure 8 - 1 through the shadowed boxes for the range and azimuth processing functions. This graph also shows the source and sink boxes. The source node provides a frame of data to the family of range processing and the sink displays the processed image. The input data to the range processing arrives at a fixed rate. Within the Source box there is a Split node which is used to distribute the data for the range processing to the various processors.
8.2 Cluster Processing
The Echo Tracker Classifier (ETC) problem (see ETC4ALFS on COTS Hardware Case Study) has been implemented using Data Flow. The overall DF graph consists of two major subgraphs, the front end and back end. The ETC graph has been set up hierarchically with the top level graph shown in Figure 8 - 6

![]()
![]()
![]()
![]()
Next: 9 Conclusions
Up: Appnotes Index
Previous:7 Primitive Construction