Up:Case Study Index Previous:10 References
![]()
![]()
![]()
![]()
Up:Case Study Index
Previous:10 References
Think of a machine or a system that performs a function and can be explained by a block
diagram, like a data modem. The first step in creating a block diagram is to functionally
decompose the design. Figure A-1 shows an entire modem communications system
containing a source, modulator, transmission line or "channel," demodulator, and display.
Each box can be a subsystem, a single function, or a representation of some physical
phenomenon like a communications transmission (atmosphere or fiber-optic cable).
In this diagram, the output of the source goes into the modulator, whose output is
transmitted across a channel to a demodulator and then displayed. The output port of one
function block is connected to the output port of the next block. Until the source starts to
generate output, nothing occurs. Likewise, the activity of each block in the chain depends
on the input of the previous block. Also, each functional block may have to wait until it
receives a "certain amount" of information before it begins processing; this is called the
threshold or "firing granularity." For example, if the modulator encodes more than one bit
of information at a time - for example, two bits - it has to wait for two bits of data from
the source. Another example is a Fast Fourier Transform (FFT). A radix-2 FFT must have
2N data tokens before it can execute. Until the function's input port receives
that much data, the function cannot execute. Therefore, the FFT has a threshold or firing
granularity of 2N.
For a function to execute, the output port must have a place to go to continue the data flow.
This is an important idea in data-flow design. Data-flow graphs (DFGs) are "data driven."
For a function to execute, all inputs must be available and there must be some place to put
the output. This lends itself to the idea of information flowing through a system.
In a DFG environment, an application can be designed by installing some basic building
blocks and then adding specifics in a hierarchical, top-down fashion. The user can design
some hierarchical boxes that will be used later in larger graphs, bottom-up. Or an entire
application can be designed in a single level.
In the parallel control-driven model, special parallel control operators are used to explicitly
specify parallelism. These operators allow more than one thread of control to be active at a
time and provide synchronization for these threads.
In theory, there are some typical characteristics identified for the sequential and parallel
control-driven models.
Programs that have a control-driven computation organization have complete control over
function sequencing. Synchronous computations are performed in the control-driven
paradigm using centralized control. In a conventional programming methodology, a
declarative language is used and an intelligent compiler is needed to generate the centralized
control and optimization processes.
Data flow is based on the concept of data-driven computation. In a data-driven computing
environment, functions execute when data is available. The main difference between
control-driven and data-driven paradigms is that the program counter drives the former and
data availability drives the latter.
In the data-flow approach, a functional programming environment generates a flow graph.
The flow graph generates code with distributed control, which is mapped onto an
architecture. Data-flow computations have a data-driven organization characterized by an
inspection stage. Input/output queues are inspected for data availability and for a place to
put results, accordingly. Once these criteria are satisfied, the data immediately execute if the
processor is available.
The data-driven concept implies that many functions can be executed simultaneously and
asynchronously. That is, functions can execute in parallel on an appropriate architecture. A
high degree of implicit parallelism may exist in data-flow applications. Information in a
data-flow application are packets of data tokens. A function is represented by the graphic
on a canvas and destinations of its data are shown by connections. A data token is
composed of a resultant value and many of these tokens are passed among the various
resources in a data-flow application. Functionally decomposing any application into basic
building blocks provides great flexibility in design and reuse and allows multiple designers
to work on the same project. Also, the use of the "family" notation greatly increases a
designer's ability to quickly implement large algorithms containing regular structures.
A DFG is a directed graph whose nodes correspond to operators, and connections are
pointers for forwarding data tokens. The graph demonstrates sequencing constraints
(consistent with data dependencies) among instructions. In a data-flow application, DFGs
represent the program. The firing rule of functions is based on data availability.
A DFG can be thought of as a collection of nodes, each node having input/output data
ports, and a collection of arcs, connecting output ports to one or more input ports. A DFG
operates by " firing" nodes that are " ready. " A node becomes ready when it has sufficient
data on its input ports and enough room on its output ports to fire. When a node fires, it
may " consume" data from one or more of its input ports and " produce" data on one or more
of its output ports. When a node fires and executes its " function, " there may be some type
of data transformation between input/output data. Data on an output port is transferred to
the destination input ports of other nodes to which it is connected via arcs. When a node
fires, it changes the state of the system by consuming and producing data. This, in turn,
may make other nodes ready to fire. There may be many nodes that are ready to fire at a
given time. The process of creating the sequence in which nodes fire is called " scheduling. "
In multi-processor systems, the process of distributing nodes to different processors on
which they will fire is called " mapping. " There are numerous scheduling and mapping
strategies. The applicability of a given strategy depends greatly on the type of nodes of
which the DFG is composed, target hardware on which the graph is to be scheduled, and
type of communication paths on which the data may travel.
This type of processing typically involved Single Instruction, Multiple Data (SIMD)
calculations. The same small program code was executed again and again using different
data. Instead of doing the calculations over and over, some of them were done
concurrently. The number of concurrent processing pipes was the number of families in the
application. The number of families could also be the number of processors the application
would execute.
Start the construction of a graph named SAR by performing the following:
The SAR image processor creates a two-dimension image using the signal
from an airplane-mounted radar pointed sideways toward the ground. One
dimension, called range, is along the line-of-sight of the radar
antenna. The second is parallel to the ground path of the airplane. The
processing is done in two steps. First, in the range dimension the
reflection signal from each radar pulse is processed. After processing
some number (64 in this example) of pulse returns, the processed data
sequences are lined up alongside the previous frame and azimuth
processing is done in the other dimension. One half of the result in
each azimuth sequence is saved for the output. For this vector-oriented
processing the data must be transposed, or corner-turned, between the
range and azimuth processing sections.
Enter the image data by performing the following:
Process radar range by performing the following. Figure A- 4, SAR Range Processing, is the DFG that results from performing this effort.
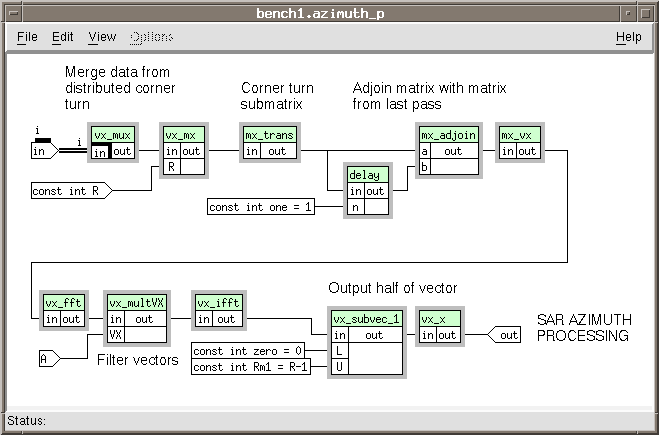
Process radar azimuth by performing the following. Figure A- 5, SAR Azimuth Processing, is the DFG that results from performing this effort.
It is instructive to see what schedule of events the application executes, and memory map it
uses before changes are made. Select View
Embed an application by performing the following:
Figure A- 12 is the schedule of events for this application. It has all the embeddable functions in a single partition executing on a single processor with one memory map. This single schedule should be used as a baseline when comparing performance of distributed execution. This is what happens when you do not distribute.
The execution times, " f_time " and " total_time, " are only valid after
executing the graph with Utilities
Select which processor each partition will execute by performing the following:
Cross a partition boundary by performing following:
The available data paths that can be used are set in the configuration file
"embedded/embedded_config." This file details the types of communication paths
available to the system in the "Communication_Desc" section.
Once a single embeddable function box in a graph is used, a group is created and its
execution characteristics can be selected. When selections are made, a schedule of
execution events is created. When the graph is run, the static schedule of events is used to
generate C -language program code. The code is compiled using the native compiler of the
machine on which that code will execute. When GC
Appendix
A.1 Introduction to Data-Flow Methodology
What is data flow and how does the application developer design with it? The data-flow
design philosophy has existed a long time, although it may not always have been called
"data flow." Anyone who has used block diagrams to help explain or solve a problem has
used something similar to data-flow techniques.
![]()
A.1.1 Control-Driven Versus Data-Driven
Computing
Conventional programming is based on the concept of being control-driven. Applications
execute each instruction under sequential program control. Programs execute the instruction
at a location indicated by a program counter. Execution continues in the sequence of
instructions pointed to by the changing address locations in the program counter. An
instruction executes only when its address is in the program counter. Each program
instruction executes and saves the result in some memory location. Results are passed from
instruction to instruction, primarily by reference to the memory addresses where the results
are stored. An instruction executes in its turn and the program assumes that the correct data
exists in currently addressed memory locations. Everything has to be ready when the
program statement executes. In this sequential control-driven model, there is a single thread
of control that is passed from instruction to instruction by the program counter.
A.1.2 Data Flow Design
Data-flow programs are typically represented by directed graphs that show the flow of data
between functions. Data-driven models also have some typical characteristics:
A.2 Autocoding the Synthetic Aperture Radar
(SAR) Using GEDAE™
This section describes a step-by-step construction of the SAR application using the
GEDAE™ (Graphical Entry Distributed Applications Environment) tool set. This
work occurred one year after the SAR benchmark was originally completed. The resulting
autocoded application achieved the same execution and memory efficiency as the hand-
coded version but with about a 10X reduction in implementation time. The same
GEDAE™SAR application was successfully remapped to three other architectures
without modifying the original DFG. This was done by simply repartitioning and
remapping the application to the new architecture. These remappings were accomplished in
only a few hours.
A.2.1 Building the SAR Application
The SAR application had four parts: simulated source (in place of a real time source/sink),
simulated display (instead of a real radar scope terminal), and two data-processing
segments. The interesting part of the application design was building it in sections that
could be concurrently executed; therefore, the distribution method was important.
Into a work directory, add the following hierarchical boxes. Figure A-2 shows the results of this effort.
- sar_source
- sar_range
- sar_azimuth
- sar_sink 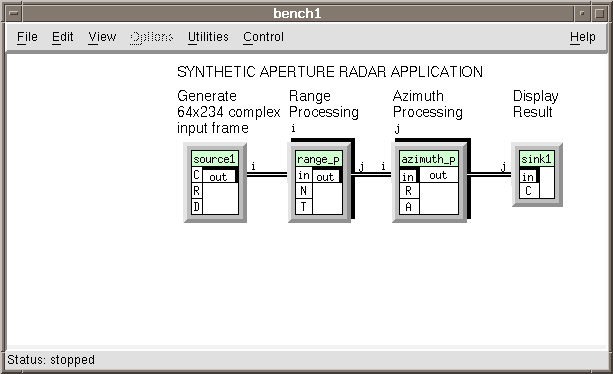
A.2.1.1 The SAR Source
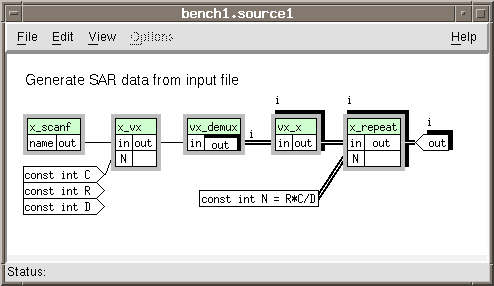
Instead of having a real radar source, the input data was simulated by reading a formatted
file of radar return-like data. The data was converted to vectors for each scan, which could
be independently processed. The next part was to demultiplex each scan line down a
different path to be processed concurrently. Because the file contained information about
only one image instead of a continuous stream of images, developers used the image many
times. Hence, the x_repeat box. This box was specially created to take as input a
specified amount of data and continuously output that data. See Figure A-3.
Open the hierarchical box sar_source.
Add the function boxes:
stream / source / x _ scanf
stream / complex / x _ repeat
vector / complex / x _ vx
vector / complex / vx _ demux
vector / complex / vx _ x
Add the data objects:
input const int C
input const int R
input const int D
local const int N = R*C / D
output out
Set the family index, Edit ![]() Set Families . . ., of the objects vx
_ x, x _ repeat, and out to "I."
Set Families . . ., of the objects vx
_ x, x _ repeat, and out to "I."
Make the connections:
x _ scanf>out ![]() x _ vx < in
x _ vx < in
const int C ![]() x _ vx < N
x _ vx < N
x _ vx>out ![]() vx _ demux < in
vx _ demux < in
vx _ demux>out ![]() vx _ x < in
vx _ x < in
vx _ x>out ![]() x _ repeat < in
x _ repeat < in
const int N ![]() x _ repeat < N
x _ repeat < N
x _ repeat>out ![]() out
out A.2.1.2 Synthetic Aperture Radar Range
Processing
This part of the processing takes a complex FFT on a zero-padded fixed-size vector. After
the FFT was calculated, developers cut the vector in preparation for the "matrix transpose"
prior to azimuth processing. The bulk, or coarse granularity, of the transpose would be
accomplished through the connections. These connections would be between different
processors.
Open the hierarchical box sar_range.
Add the function boxes:
embeddable /vector /complex /x _ vx
embeddable /vector /complex /vx _ multV
embeddable /vector /complex /vx _ zfill
embeddable /vector /complex /vx _ fft
embeddable /vector /complex /vx _ fft
Add the data objects:
input in
input const int N
input T
local const int n = log(N) /log(2.0)
local const int M = 1 < < n
local const int n1 = M < N ? n+1 : n
local const int M1 = 1 < < n1
local const int Pad = M1 - N
output out
Notice that in the definition of n1 there is a conditional expression.
Set the family index, Edit ![]() Set Families . . ., of the output out to
"I."
Set Families . . ., of the output out to
"I." 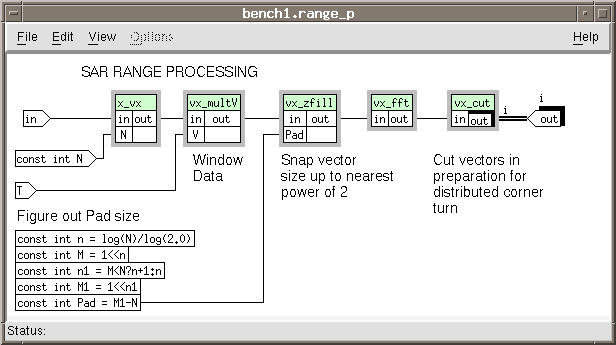
Make the connections:
in ![]() x_vx<in
x_vx<in
const int N ![]() x_vx<N
x_vx<N
x_vx>out ![]() vx_multV<in
vx_multV<in
T ![]() vx_multV<V
vx_multV<V
vx_multV>out ![]() vx_zfill<in
vx_zfill<in
const int Pad ![]() vx_zfill<Pad
vx_zfill<Pad
vx_zfill>out ![]() vx_fft<in
vx_fft<in
vx_fft>out ![]() vx_cut<C
vx_cut<C
vx_cut>out ![]() out
out A.2.1.3 Synthetic Aperture Radar Azimuth
Processing
This segment applies a Taylor window and then completes the matrix transpose at a finer
level. It puts the matrix pieces back together and divides them into vectors. An FFT is
performed on the vectors with a specially designed AZimuth KERnel (azker coefficients)
window applied. An inverse FFT is done before the vector is formatted for output. (Details
have been left out. )
Open the hierarchical box sar_azimuth.
Add the function boxes:
embeddable/vector/complex/vx_mux
embeddable/matrix/complex/vx_mx
embeddable/matrix/complex/mx_trans
embeddable/delay
embeddable/matrix/complex/mx_adjoin
embeddable/matrix/complex/mx_vx
embeddable/vector/complex/vx_fft
embeddable/vector/complex/vx_multVX
embeddable/vector/complex/vx_ifft
embeddable/vector/complex/vx_subvec
embeddable/vector/complex/vx_x
Add the data objects:
input in
input const int R
input A
local const int one = 1
local const int zero = 0
local const int Rm1 = R-1
output out
Set the family index of input in to "i."
Make the connections:
in ![]() vx_ mux< in
vx_ mux< in
vx_ mux> out ![]() vx_
mx< in
vx_
mx< in
const int R ![]() vx_ mx< R
vx_ mx< R
vx_ mx> out ![]() mx_
trans< in
mx_
trans< in
mx_ trans> out ![]() mx_
adjoin< a
mx_
adjoin< a
mx_ trans> out ![]() delay< in
delay< in
const int one ![]() delay< n
delay< n
delay> out ![]() mx_ adjoin< b
mx_ adjoin< b
mx_ adjoin> out ![]() mx_
vx< in
mx_
vx< in
mx_ vx> out ![]() vx_
fft< in
vx_
fft< in
vx_ fft> out ![]() vx_
multVX< in
vx_
multVX< in
A ![]() vx_ multVX< VX
vx_ multVX< VX
vx_ multVX> out ![]() vx_
ifft< in
vx_
ifft< in
vx_ ifft> out ![]() vx_
subvec< in
vx_
subvec< in
const int zero ![]() vx_ subvec<
L
vx_ subvec<
L
const int Rm1 ![]() vx_ subvec<
U
vx_ subvec<
U
vx_ subvec> out ![]() vx_ x<
in
vx_ x<
in
vx_ x> out ![]() out
out A.2.1.4 The Synthetic Aperture Radar
Display
Process radar display by performing the following. Figure A- 6, SAR Display (Sink) is the DFG that results from performing this effort.
Open the hierarchical box sar_sink.
Add the function boxes:
stream / complex / x_copy
vector / complex /x_vx
vector / complex /vx_mux
Add the hierarchical box: my_work/display_sar
Add the data objects:
input in
input const int C
Set the family index, Edit ![]() Set Families. . ., of the
objects in, x_copy, and x_vx to "j."
Set Families. . ., of the
objects in, x_copy, and x_vx to "j."
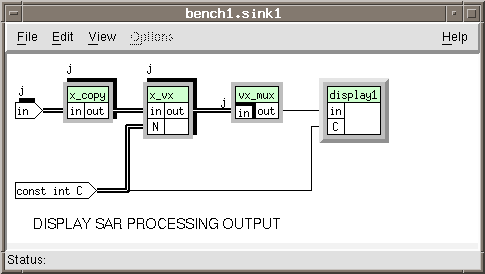
Make the connections:
in ![]() x_copy < in
x_copy < in
x_copy < out ![]() x_vx < in
x_vx < in
const int C ![]() x_vx < N
x_vx < N
x_vx > out ![]() vx_mux < in
vx_mux < in
Open the hierarchical box display_sar. Figure A- 7, SAR Sink Display, is the DFG that results from performing this effort.
Add the function boxes:
vector/complex/vx_x
stream/complex/x_mag
vector/s_v
vector/sink/v_disp
Add the data objects:
input in
input const int C 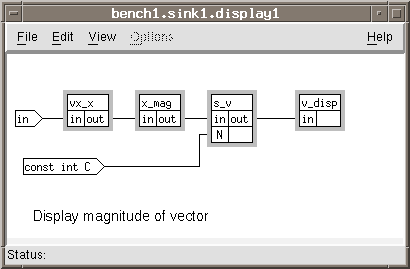
Make the connections as shown:
in ![]() vx_x < in
vx_x < in
vx_x > out ![]() x_mag < in
x_mag < in
x_mag > out ![]() s_v < in
s_v < in
const int C ![]() s_v < N
s_v < N
s_v > out ![]() v_disp < in
v_disp < in
Close the hierarchical box display_sar.
In the sar_sink box finish making the connections.
vx_mux > out ![]() display_sar < in
display_sar < in
const int C ![]() display_sar < C
display_sar < C
A.2.1.5 Finishing the Top Level
Add the remaining data objects by performing the following (These data will define all the
family sizes and operating parameters). Figure A- 8, completed SAR Application DFG, is the final SAR DFG that results from performing this effort.
The local variable taylor[] is an array with 234 floating-point values. The local
variable azker[] is an array with 128 complex number values. Instead of typing in
362 values in two arrays, developers have included in the FGlibraries/datafiles the
files: " taylor_vals " and " azker_vals. " These are two ASCII
files that can cut and paste the multiplicative window coefficients.
Add the data objects:
local const int n = 2
local const int m = 2
local const int N = 1 < < n
local const int M = 1 << m
local const int C = 234
local const int R = 64
range i = 0..N-1
range j = 0..M-1
local const float taylor[] = . . .
local const complex azker[] = . . . 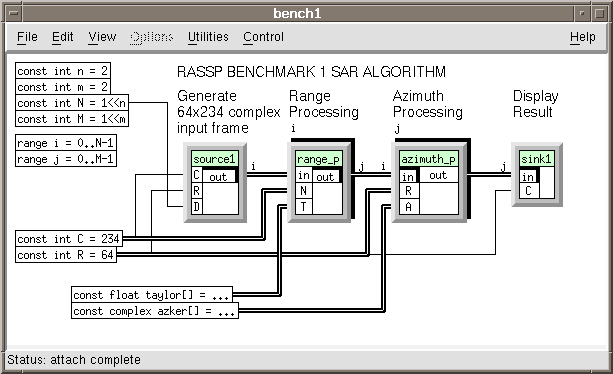
Make the connections as shown:
const int C ![]() sar _ range < N
sar _ range < N
const int C ![]() sar_ source < C
sar_ source < C
const int R ![]() sar _ azimuth < R
sar _ azimuth < R
const int R ![]() sar _ source < R
sar _ source < R
const int R ![]() sar _ sink < C
sar _ sink < C
const int N ![]() sar _ source < D
sar _ source < D
float taylor [] ![]() sar _ range < T
sar _ range < T
complex azker[] ![]() sar _ azimuth < A
sar _ azimuth < A
sar _ source > out ![]() sar _ range < in
sar _ range < in
sar _ range > out ![]() sar _ azimuth < in
sar _ azimuth < in
sar _ azimuth > out ![]() sar _ sink < in
sar _ sink < in
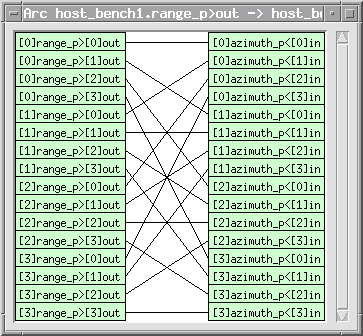
Double click on the family connection between the sar _ range and sar _
azimuth boxes. The connection pattern made is between a family of boxes indexed on
"i" with a family output to a family of boxes indexed on "j" with a family input. This
does not create an "all to all" connection scheme. Instead, the undefined family I/O
indices are instantiated with the index of the box to which it is connected. The
connection pattern is then between [j]i ' [i]j. Figure A- 9 the defined data-path pattern
when this connection is made.
A.2.2 Running the Graph
Run the graph by selecting Control ![]() Run . Figure A- 10, output of SAR Graph, displays the results of the SAR Processing that was performed on the input data file.
Run . Figure A- 10, output of SAR Graph, displays the results of the SAR Processing that was performed on the input data file.

A.2.3 Distributing or "Embedding" the Graph
After the graph is built and tested, developers can look at distribution and performance on
an " embedded " system. This section describes how to perform the techniques
necessary to embed an application. There is no one way to get efficient performance,
achieving that is application and hardware specific. Methods used to achieve higher
performance are more important than performance itself.
![]() Groups. Depending on the
options chosen, the function box titles will change color to reflect its " group. " A
group is the largest collection of connected embeddable boxes that can have their execution
scheduled in the same " Static Schedule. " Each group can be partitioned for
greater execution control.
Groups. Depending on the
options chosen, the function box titles will change color to reflect its " group. " A
group is the largest collection of connected embeddable boxes that can have their execution
scheduled in the same " Static Schedule. " Each group can be partitioned for
greater execution control.
Select the sar_range box or any box connected to sar_range
with the same color.
Select Options ![]() Group Control... (GC)
The " Group Control " window opens Figure A- 11.
Group Control... (GC)
The " Group Control " window opens Figure A- 11.
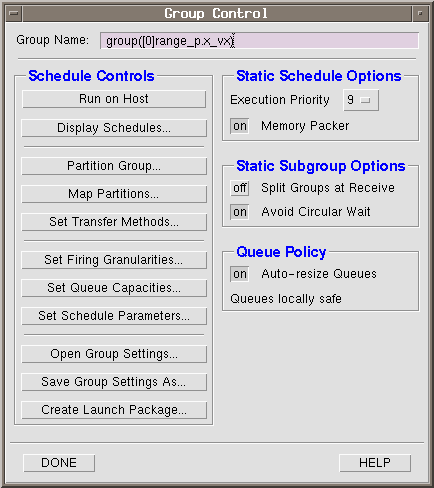
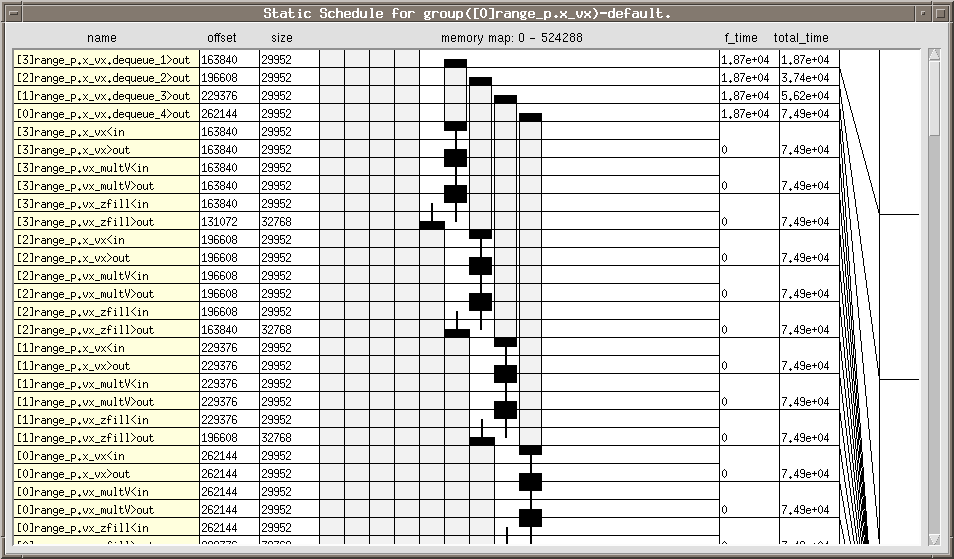
Select GC ![]() Display Schedules. . . .
The " Static Schedule " of events that opens lists every function and every
data transfer that is required for the execution of the application. Because the
application has not been partitioned into smaller execution units, GEDAE™
executes, by default, the application on a single host processor. The application will
execute on a single processor even if the host is made up of multiple processors. To
take advantage of multiple internal processors, the application must be partitioned and the
partitions mapped to separate processors.
Display Schedules. . . .
The " Static Schedule " of events that opens lists every function and every
data transfer that is required for the execution of the application. Because the
application has not been partitioned into smaller execution units, GEDAE™
executes, by default, the application on a single host processor. The application will
execute on a single processor even if the host is made up of multiple processors. To
take advantage of multiple internal processors, the application must be partitioned and the
partitions mapped to separate processors.
![]() Enable Trace turned on.
Enable Trace turned on.
A.2.3.1 Partitioning
Perform the following to partition the elements of a group forming smaller units and then
have each unit execute on a different processor:
Select GC ![]() Partition Group. . . .
With the " Partition Table " (figure A- 13) window, it may be easier to partition the functions if the table were reduced to the level of functions, hierarchical or primitive, that were going to be mapped. This application is partitioned along " family
" lines. The family index will be used as the guide on how to partition the
application and name of the partition.
Partition Group. . . .
With the " Partition Table " (figure A- 13) window, it may be easier to partition the functions if the table were reduced to the level of functions, hierarchical or primitive, that were going to be mapped. This application is partitioned along " family
" lines. The family index will be used as the guide on how to partition the
application and name of the partition. 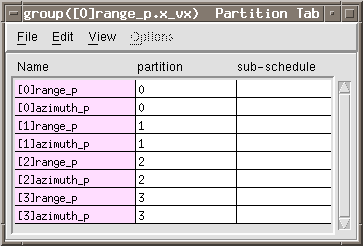
The table display has been collapsed to show only the family indexed
hierarchical boxes and then rearranged in numerical order. To do this, double-click on
the sar_range and sar_azimuth entries to collapse, and then drag-
and-drop to reposition.
To enter a function box's partition:
Select the function box.
Select the table's Options ![]() Set Partition. . . .
Set Partition. . . .
In the panel of the input dialog that opens, type the name of the partition.
Follow the above three steps to set the partitions of the all the boxes as shown in
Figure A- 13. Use as partition names the box's family index. A.2.3.2 Mapping
After partitioning the application, the next step is to select on which processor each partition
will execute. In this dialog, assign a " processor number " corresponding to the
partition name. The processor number is a specific designation from the "
embedded/embedded_config " file and it is a hardware-specific name listed under
listed under " Processor_Desc. "
Select GC ![]() Map Partitions. . . .
Map Partitions. . . .
Enter the processor numbers in the " Processor Number: " panel. When the
application is distributed to a workstation with multiple processors, the operating
system determines on which actual processor the partition will execute. By entering
the processor number, GEDAE™ will know how many processes to try and
execute concurrently. 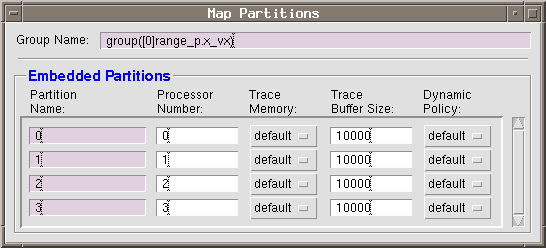
A.2.3.3 Transfer methods
The transfer methods are those paths used to send data between functions that are in
different partitions that are executing on different processors. The number of these transfers
is dependent on the number of connections that break the " partition boundary " on the graph. Any time a function box in one partition must send its output to a function in
another partition, the action constitutes crossing the partition boundary. The different types
of methods available to transfer data along these connections are dependent on the hardware
on which the application is running.
Select GC ![]() Set Transfer Methods. . . . (See Figure A- 15)
Set Transfer Methods. . . . (See Figure A- 15)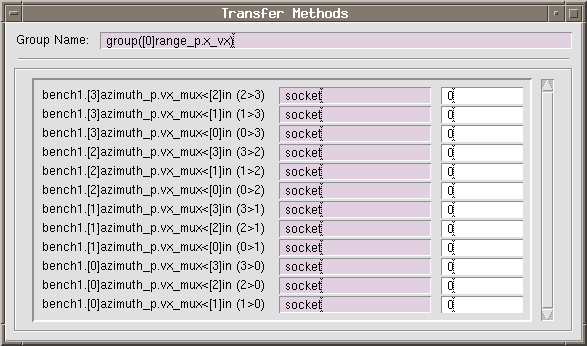
A.2.3.4 Schedule
View some results by performing the following (Now that all of the performance enhancing
techniques and characteristics have been entered:
Select GC ![]() Display Schedules (figure A- 16) . . ..
Because four partitions have been created, four "Static Schedule " windows
open. Because each partition executes the same algorithm, each schedule is similar if
not identical. The schedules will change when any of the group's or partition's
operating characteristics change. This results in a change in the memory and time
requirements for the new schedule.
Display Schedules (figure A- 16) . . ..
Because four partitions have been created, four "Static Schedule " windows
open. Because each partition executes the same algorithm, each schedule is similar if
not identical. The schedules will change when any of the group's or partition's
operating characteristics change. This results in a change in the memory and time
requirements for the new schedule. 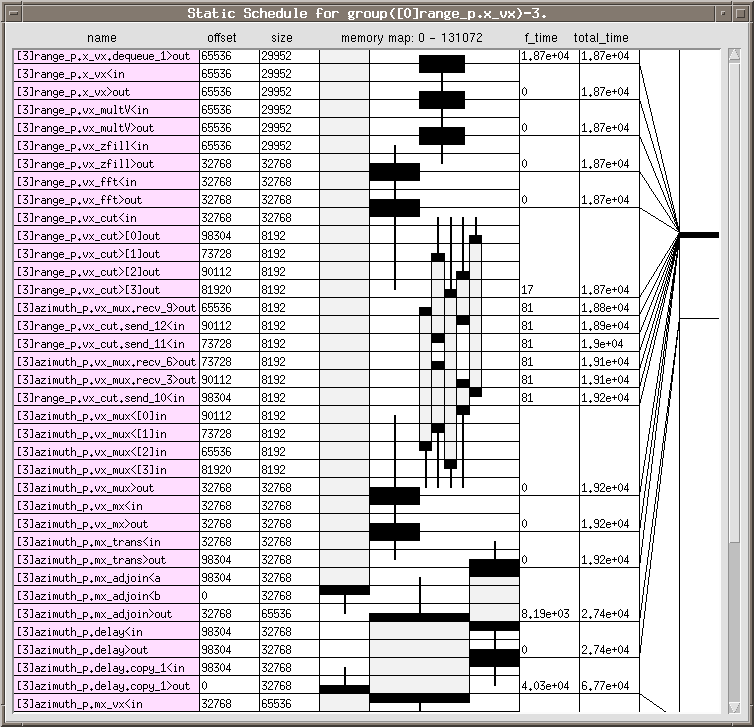
A.2.3.5 Embedding
Section A.2.3 was a prelude to actually embedding and running an application on multiple
processors. Because a schedule was created without selecting any particular operating
characteristics, Figure 6.2-5, developers could have skipped Sections A.2.3.1 through
A.2.3.4. As simple as GEDAE™ has made it to partition and map an application, its
even easier to run the graph on multiple processors once partitions are assigned to
processors (Ref. Section A.2.3.2).
![]() Run on Embedded, a
separate polled process, is started whose function is to perform the events in the schedule.
Run on Embedded, a
separate polled process, is started whose function is to perform the events in the schedule.
![]()
![]()
![]()
![]()
Up:Case Study Index
Previous:10 References