MSE Classifier Functional Analysis and Implementation

One of the primary functions of the SAIP HighClass processor is to determine the most likely target types for an input synthetic aperture radar (SAR) image. This function is performed within the classifier subsystem of the processor. The RASSP spiral design methodology was used for the development of the MSE Classifier subsystem. As a part of the initial spiral cycle, the classifier functional requirements were established. During the second spiral, classifier algorithmic refinements were made that reduced the computational requirements and the feasibility of implementing the classifier on COTS hardware was established. Finally, as part of the third spiral, the classifier data flow graphs were developed.

1.0 Classifier Activities During the System Design Cycle

The focus of the System Design Cycle was to establish the functional requirements for each of the processing subsystems. MSE Classifier precision analyses were performed during this phase to determine the precision needed in both the templates data and in the computation precision of the classifier scores. In addition, algorithmic refinements were identified that reduced the overall computational requirements.

1.1 Classifier Functional Description

The function of the classifier is to determine which sets of targets in the template library best match the input radar image chip. The top-level block diagram of the classifier is shown in Figure 1-1. The classifier implementation used a two-stage process. In the first stage of the classifier, a score was calculated for each low resolution template file which measured how well the template file matches the low resolution image chip. This score was calculated as

score(m,n) = (1/N) S S ( X(i,j) - T(m + i , n + j) ) 2 i j

where the parameters within this equation are given by

   N represents the number of valid pixels within the template file,
   X(i,j) is the input image,
   T(m + i , n + j) is the template data,
   i and j span the two dimensions of the image data, and
   m and n account for different starting offset locations within the template file.

There were 72 pose angles for each target class within the template files. Since the exact target orientation was unknown, various offset (dither) locations are used within each template file to determine the best score for that file. The pose angle and offset location resulting in the best (lowest) score for each target class were determined. The best five target classes were passed to the second stage of the algorithm, along with their respective best pose angle and offset location.

In the second stage of the classifier, scores were calculated for a set of high resolution templates files using the high resolution target image provided by the high definition imaging (HDI) subsystem. The score was calculated in the same fashion as the score in the first stage. The major difference in the second stage was that all template files were used during the first stage to determine the best match, while only a subset of templates were pose angles and offset locations used in the second stage. The subset of high resolution templates used for the second stage were based on the best low resolution target classes and their respective pose angles and offset locations. The second stage classifier returns the best target classes with their classification scores to the SAIP system.
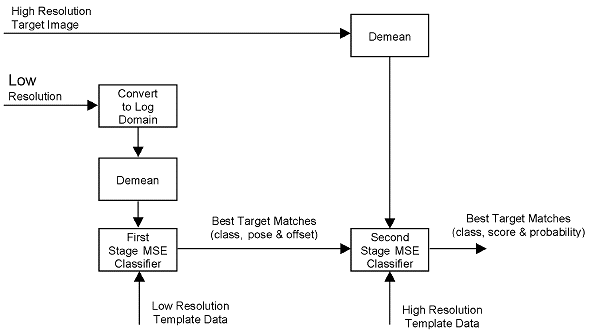
Figure 1-1: Classifier Block Diagram

The number of operations required to calculate the scores for each stage of the classifier are summarized in Table 1-1. These requirements were based on the statistics of the template files for the 10 target types provided by MIT-LL in the initial executable specification. A processing rate of 2.9 Gops per second was required to process image chips at an input rate of 30 images per second.

Table 1-1: Classifier Processing Requirements for a Single Image Chip

Classifier Stage

Number of Valid Pixels per Template

Number of Offset Positions

Number of Target Classes

Number of Pose Angles

Number of Operations (MOp)

First Stage

162

121

20

72

84.7

Second Stage

1182

49

5

14

12.1

1.2 Template Precision Analysis

It was originally planned to implement the classifier on a custom board using an FPGA as the basic processing element. This implementation was chosen because the classifier algorithm performs the same three mathematical operations repetitively in evaluating the template sets. Initial classifier analyses were established to determine the number of bits needed to store the template data to reduce the memory requirements for the templates. The templates files, received as part of the executable specification, were in double precision, floating point format. A simulation was developed to model the classification algorithm with various template data precision levels. The simulation was used to determine the number of bits needed in the template data to maintain the accuracy of the classifier. The mean square error of the classifier scores for the test images using the executable specification and the scores using various number of bits of precision for the template data is shown in Figure 1-2 for both stages of the classifier. The full 32 bit, floating point precision was used for both the input image data and the classification computation in this simulation. From these results, it seemed reasonable that at least 10 bit precision was needed to represent the first stage template files, while 8 bit or more was required for the second stage.
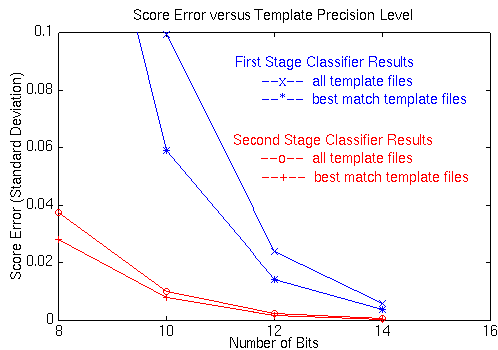
Figure 1-2: Classifier Error Analysis Using Variable Template Precision

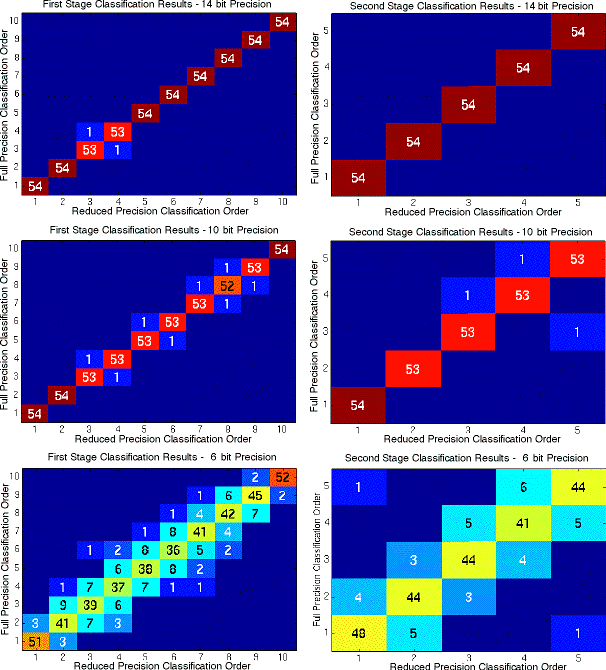
Since there was not a specific requirement for the allowable classification score error, we needed to know how this error impacted system performance. A confusion diagram illustrating the classification rank order differences between the ideal and limited precision templates is shown in Figure1-3 for both the first and second stages of the classifier. In the diagrams, the horizontal axis represents the rank order for the limited precision classifier, while the vertical axis represents the position rank of the ideal classifier. The number within a box represents the number of images (out of the 54 test images) that the limited precision classifier ranked in the x coordinate rank that the ideal classifier ranked in the y coordinate rank. The confusion diagram for a limited precision classifier with no misclassifications would have all of its outputs on the diagonal. These results indicated that acceptable system performance is obtained if 10 bits or more were used for the first stage templates, and if 8 bits or more were used for the second stage templates. Based on these results, classifier memory requirements could be reduced by 50 to 75 percent if the templates were stored using limited precision instead of the full 32 bit, floating point format.
1.3 Classifier Computational Precision Analysis

The initial implementation approach for the classifier was based upon a custom FPGA board. The precision required to compute the classification calculation, with sufficient accuracy, and minimize the number of gates in the FPGA design also needed to be determined. The simulation used to model the template precision was used again to determine the number of bits needed to perform the MSE computation. Figure 1-4 shows the mean square error of the classifier scores for the 54 test images and the classifier score using various precisions for the image data for both stages of the classifier. The first stage templates were limited to 10 bits of precision and the second stage templates at 8 bits for this analysis. From these results it seemed reasonable that 12 or more bits of precision were needed for the first stage classifier computation, and that 10 or more bits were needed for the second stage calculation.
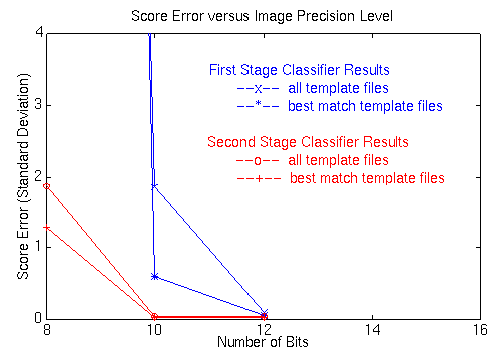
Figure 1-4: Classifier Error Analysis Using Variable Precision for Image Data

Again, we needed to know how this error would impact system performance. A confusion diagram illustrating the classification rank ordering differences between the ideal and limited image precision is shown in Figure 1-5 for both the first and second stages of the classifier. These results indicated acceptable system performance was obtained if 12 bits or more were used for the first stage, and 10 bits or more were used for the second stage.
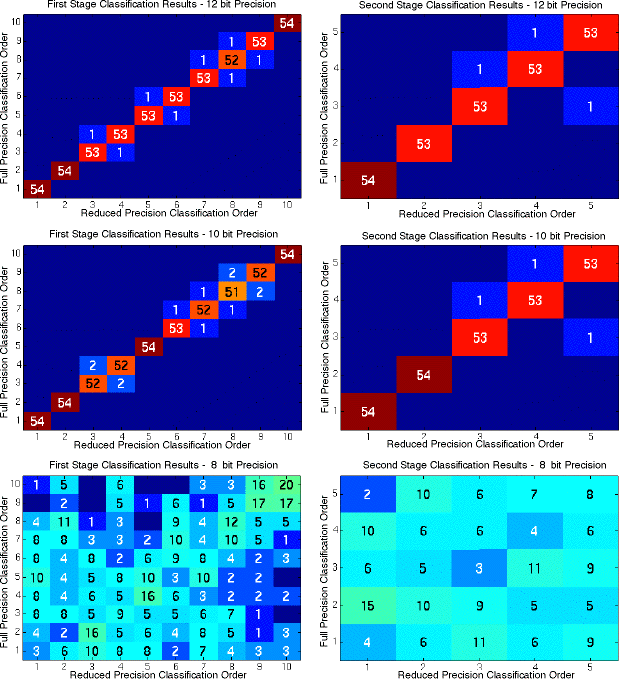
Figure 1-5:Classification Results with Variable Image Precision

1.4 Classification Algorithm Tradeoffs

The classifier is a mean square error (MSE) algorithm since the average of the squared difference between the image and template values is calculated in determining the score. The initial classifier implementation approach was based on a custom board using an FPGA as the computational unit. The multiplier in the classification algorithm required over 85 % of the FPGA gates to perform the squaring function. As a result, the impact of changing the MSE classification algorithm to a mean absolute difference (MAD) algorithm was investigated. The only change to the original algorithm was that the square operation is replaced by an absolute value operation which required no FPGA gates..

A comparison of the MSE versus MAD classification results for the test images are summarized in the tables below. The number of times the ground truth target appeared in a particular rank order of the classifier output is given in these tables. The ground truth target would always occur in the first rank position for an ideal classifier. These results indicated the performance of the MAD classifier is as good or slightly better than the MSE classifier for the test data set. For the MAD classifier, 41 of the 48 ground truth targets were in the top two positions, as opposed to the 38 targets in the top two positions for the MSE classifier. After reviewing these results and understanding the impact on a custom solution, it was determined that either the MSE or MAD algorithm could be used for the classifier subsystem.


Mean Square Error (MSE) Classification Results

Ground Truth Target

Classification Order

BMP 2

BTR 60

BTR 70

M110

M113

M1A

M2A

M35

M548

T72

Total

Rank 1

5

2

2

2

3

2

4

3

3

6

32

Rank 2

2


1

1


1


1

6

Rank 3

1

1


2


1

5

Rank 4


1

1


2

Rank 5


1


1

Other

1


1

2

Total

9

3

3

3

3

3

9

3

3

9

48


Mean Absolute Difference (MAD) Classification Results

Ground Truth Target

Classification Order

BMP 2

BTR 60

BTR 70

M110

M113

M1A

M2A

M35

M548

T72

Total

Rank 1

5

2

3

2

3

1

4

3

3

5

31

Rank 2

1

1


1

3


4

10

Rank 3

1


1


1

2


5

Rank 4


Rank 5


Other

2


2

Total

9

3

3

3

3

3

9

3

3

9

48

Table 1-2: Comparison of MSE and MAD Classification Results

1.5 Early Termination Algorithm Enhancements

The original classification algorithm determines the score for each offset location for every pose angle for each of the 20 target classes. Since only the best score of all possible offset positions and pose angles is needed for each target class, we discovered the score calculation could be terminated within a target class if it exceeded the best previous score for the target class. Note the best score is the lowest score. Modifications were made to the classification simulation to take advantage of early termination, and determine the computation improvement for the 54 test images. The computation savings obtained from early termination are summarized in Table 1-3 for each ground truth target type for both the first and second stage classifier. These results indicated the potential for significant computational savings by incorporating early termination in the classifier algorithm. The overall processing rate of the classifier dropped from 2.9 Gflops per second to 1.3 Gflops per second when the early termination algorithm enhancement was applied. As a side note, this simple algorithm modification has been incorporated in the baseline SAIP system.

Table 1-3: Computation Savings Achieved Using Early Termination
 

Ground Truth Target


BMP 2

BTR 60

BTR 70

M110

M113

M1A

M2A

M35

M548

T72

M109

HMMWV

Avg

First Stage

.558

.568

.590

.562

.565

.580

.569

.528

.545

.584

.559

.531

.565

Second Stage

.346

.348

.318

.387

.348

.290

.374

.350

.388

.346

.333

.309

.348

1.6 Summary of Classification Activities During the System Design Cycle

The functional requirements for the classifier were established during the system design cycle. Emphasis was placed on determining the precision requirements of the classification algorithm. These precision analyses indicated the random access memory requirements to store the templates could be reduced by at least 50 percent and the algorithm could be performed using as few as 12 bits.

In addition, several classification algorithm enhancements were made during the system design cycle. The performance of the classifier using a mean absolute difference (MAD) algorithm was shown to perform as well as the MSE classifier. This result was significant for the custom implementation since the number of the FPGA gates could be reduced by a factor of four if the absolute value operator was substituted for the multiplier.

The other algorithm enhancement discovered during this design cycle was the early termination approach. This approach reduced the classifier computational requirements by more than a factor of two. Since the early termination approach is more suitable for implementation on a DSP, it was decided to perform further studies in the next phase to determine whether a COTS approach was feasible for the classifier.

2.0 Classifier Activities During the Preliminary Hardware/Software Co-design Cycle

The major focus of the Architecture Hardware/Software Co-design Cycle was to determine the final architecture for the BM4 processor. The design activities for the classifier were concentrated in three areas: further algorithm enhancements to reduce the computational requirements, additional tradeoff analyses to determine the architecture for a custom implementation, and development of runtime estimates for implementing the classifier on COTS DSP processors.

2.1 Refinement of the Early Termination Approach

During the system design cycle, an early termination approach was developed which reduced the classifier computational requirements by more than a factor of two. Since this improvement was better suited to a digital signal processor (DSP) instead of a custom logic approach, additional analyses were performed to determine if further algorithmic improvements could be made for a DSP solution.

The first improvement made was to rasterize the template files. Each template file contains a two dimensional array of values which reflect the down range and cross range pixels for the synthetic aperture radar image. A pair of indexes was used to indicate the location of each valid pixel in the template file. Since the valid pixels within the template file were typically adjoining, a more efficient method for accessing template data is to store the values of contiguous valid pixels in a one dimensional array and store only the index for the first pixel and the number of pixels for this contiguous block. This approach reduced the amount of memory needed to save the template data and reduced the overhead for indexing the data while computing the classification score. This process of representing the templates in contiguous blocks of valid pixels was referred to as rasterizing the templates. Although rasterizing did not reduce the number of operations required to perform the intrinsic classification algorithm, it did reduce the overhead for indexing the template data. Specific metrics for improving performance of the classifier were not calculated; however, the classification program ran faster by at least a factor of two when the templates were rasterized.

Other variants of the early termination algorithm were also examined to determine if the computational requirements could be further reduced. The alternative early termination algorithms examined were:

Early Termination: Terminate the score calculation when the best previous score has been exceeded within any single target class. This variant was analyzed during the system design cycle and is repeated here for comparison purposes.

Top Five: Use the fifth best target score to date as the initial threshold in the early termination algorithm when processing the sixth and higher target classes in the first stage classifier. Note only the five best target type matches in the first stage classifier are reported to the second stage.

Hotspot Rasters:Rearrange the template rasters according to their power content so rasters with the largest extreme points are processed first. This approach should allow non-matching templates to terminate faster.

Prestage: Process the first "N" rasters for all template files. Sort the results to determine the best order to process the target classes, pose angles, and offset locations.

Hot Pixel: Remove the "N" pixels with the largest extreme values from their rasters and include these pixels as the first "N" rasters within the template file.

The results for each of these algorithmic variants are summarized in Table 2-1. The percentage of pixels processed for both the first and second stage classifier is given in this table for each approach. The results indicated the intrinsic computational requirements were reduced for each successive algorithmic variant. However, the impact of performing the comparison and indexing overhead is not included in this table. The early termination algorithm with hotspot rasters was selected as the baseline approach since the indexing overhead was a minimum with this approach and the processing for each template class is independent from the other classes. This approach simplified the partitioning of the classifier across distributed processors. It also reduced the original early termination computational requirements by 25 percent. Based upon this approach, the overall processing rate of the classifier was 1.1 Gflops per second versus the original requirement of 2.9 Gflops per second.

Table 2-1: Classifier Early Termination Algorithm Refinement Results
 

Percent Pixels Processed

Approach

First Stage

Second Stage

No Early Termination

100.0 100.0

Early Termination

47.1 63.4

Early Termination, Top 5

45.0 63.4

Early Termination, Hotspot Rasters

37.1 55.6

Early Termination, Hotspot Rasters, Top 5

35.0

-

Early Termination, Prestage 1 raster, Top 5

33.9

-

Early Termination, Prestage 2 rasters, Top 5

33.9

-

Early Termination, Prestage 3 rasters, Top 5

35.5

-

Early Termination, 5 Hot Pixels, Top 5

29.7

-

Early Termination, 15 Hot Pixels, Top 5

25.2

-

2.2 COTS Implementation Estimates for Classifier

The enhancements made to the classification algorithm are more suitable for implementation in a programmable DSP. The tradeoff studies for the custom board development indicated there was both high risk and significant development costs for developing a custom board which would meet the BM4 requirements on a single board. As a result, implementing the classifier on COTS signal processing boards emerged as an attractive approach if the classification requirements could be met using two COTS boards.

The baseline approach for implementing the high definition imaging (HDI) algorithms was to use COTS DSP boards due to the general nature of the HDI algorithm. The HDI implementation tradeoff studies indicated the processing board with 18 ADSP-21060 Sharc processors from Alex Computer Systems was the preferred COTS board based on its computation density and cost. Since a homogenous architecture for the COTS processing boards was preferred, we were interested in determining if the MSE processing requirements could be met by implementing the classifier on two Alex boards.

Initially, a real time C code version of the first stage classification algorithm using hotspot rasters was developed. This program was compiled using Analog Devices optimizing C compiler for the Sharc. This code was hosted on a Sharc processor and timing measurements were made to determine how fast the algorithm executed. We found the algorithm needed 13.8 cycles per pixel processed. These initial results indicated 138 SharcS would be needed to meet the BM4 requirements.

Analysis of the assembly code generated by the C compiler indicated many of the architectural features of the Sharc were not used in the assembly code. Although we preferred not to program the algorithm at the assembly level, significant performance improvements could be realized by modifying the assembly code. As a result, an effort was initiated to modify the assembly code to take advantage of the following Sharc features:

The modified assembly code was executed on the Sharc processor and timing measurements were performed. The modified algorithm executed at 3 cycles per processed pixel. The net result was that two man-weeks of effort produced optimization of the assembly code, which sped up the algorithm by a factor of 4.6x .

The average number of processing cycles needed to perform the first and second stage classification functions on the Sharc processor using the modified assembly code is summarized in Table 2-2. These results indicated that 25 Sharcs were needed to perform the first stage classifier, while 5 Sharcs were needed for the second stage. These estimates included a ten percent margin. Thus, from a throughput perspective two Alex boards could meet the classification requirements.

The other major consideration for implementing the classification algorithm using the Alex boards was whether the template data would fit in the internal memory of the Sharc processors. The Sharc's short word floating point format was used to store the template data to reduce the memory requirements. The short word format uses 11 bits for the mantissa, 4 bits for the exponent and 1 bit for the sign and meets the precision requirement established during the system design cycle. This short word format reduced the template storage requirements by a factor of two.

The internal memory of the Sharc has 128K words (4 bytes per word). It was assumed 30 percent of the internal memory was available for template storage. (The remainder of the internal memory is used for the operating system, program, communication buffers, stack and other data items.) Since the first stage template data needed approximately 134K words of memory, the entire template set could be stored within the internal memory of four Sharcs. This led to a requirement to distribute the algorithm over multiple Sharcs for a single image. The full second stage template set requires a total storage of 1.2M words. Since the second stage classifier uses a subset of template data in its calculation, the complete second stage template set can be stored on a root Sharc in its external memory. This root Sharc must compute the set of templates needed in the second stage, and pass this subset to the Sharc performing the second stage classification algorithm. The average size of the subset of templates used in the second stage classifier was 59.6K words and could be stored within two Sharcs.

The analysis indicated the templates for both the first and second stage classifier could be effectively handled with the Alex processing boards as long as the algorithm was distributed across multiple Sharcs. As a result, the baseline approach to implement the classifier on the Alex boards consisted of using 25 Sharcs to perform the first stage classification, and 5 Sharcs for the second stage. The 25 Sharcs used in the first stage are divided into five groups of five Sharcs. Each group of five Sharcs work together to perform the classification algorithm for one image. Each of these Sharcs contained the template data for four target classes. In a similar fashion, the second stage Sharcs were also grouped in sets. BM4 MSE Classifier requirements could be met using two Alex boards using this approach.

Table 2-2: Processing Requirements for Modified Assembly Code


Number of Target Classes


Number of Pose Angles


Number of Offset Locations


Number of Valid Pixels


Early Termination Efficiency


Cycles Needed Per Pixel Processed


Cycles Needed to Process 1 Image

(M-cycles)

First Stage

20
72
121
162
.371
3.0
31.4

Second Stage

5
14
49
1182
.556
2.4
5.4

2.3 Summary of Classifier Activities During the Preliminary Hardware/Software Co-design Cycle

Additional algorithm enhancements to reduce the computational requirements were investigated during this cycle. Modifications to the basic early termination algorithm resulted in a 25 percent reduction of the processing requirements. Optimized real time code for the classifier was developed and executed on the ADSP-21060 Sharc processor. Timing measurements indicated the classifier could be implemented on two signal processing boards from Alex. Since the custom board tradeoff activity indicated there was both high risk and significant development costs for a single board solution, it was decided to implement the classifier using Alex COTS DSP boards. The development of the final software was planned for the detailed design cycle.

3.0 Classifier Activities During the Detailed Design, Integration and Test Cycle

The feasibility of implementing the classifier algorithms on two signal processing boards from Alex Computer Systems was demonstrated during the architecture design cycle. Each of these boards have 18 ADSP-21060 Sharc processors. Since only two of these processors have external memory, the key challenge was to distribute the classifier over multiple processors and achieve the same efficiency as a single processor had.

3.1 Requirements Update

The original executable specification contained the templates for 10 target classes, instead of the full 20 classes. It was assumed that the template statistics for the 20 target classes were equivalent to the statistics of the templates we had, when determining the number of processors needed for the classifier requirements. The additional 10 target template files were received at the start of the final software design. Analysis of the new templates uncovered that the overall classifier processing requirements increased by approximately 10 percent because the number of valid pixels for the new templates was larger than the original set.

A change in the algorithm implementation approach for the classifier was needed to meet our goal of implementing the classifier on 30 Sharcs. The alternative implementation selected was the early termination algorithm with hotspot rasters using the top five extension. This algorithm variant was approximately 10 percent more efficient than the baseline, but it was more complex because the processing a particular class dependent on the results for previous classes. This algorithm variant was further complicated since the algorithm had to be performed across multiple processors due to memory limitations. The real time C code for the classifier was modified for this algorithm change and compiled for the Sharc. Again, the resulting assembly code was hand optimized to take advantage of Sharc architecture features.

3.2 First Stage Classifier

The key challenge in implementing the first stage classifier was to distribute the algorithm efficiently over multiple Sharcs. The templates for the first stage had to reside in the local Sharc's memory to reduce the communications bandwidth in the system. The full first stage template set could be effectively stored within the internal memory of four Sharcs. Therefore, an approach had to be developed which would efficiently distribute the classifier algorithm across four Sharcs.

The processing load had to be balanced as evenly as possible across the four Sharcs performing the first stage classification algorithm. Since each Sharc processes the templates for a different set of five target classes, the template classes were grouped together such that the processing load (number of template pixels) was as uniform as possible.

Performing the top five classification algorithm complicated the task of balancing the processing requirements. Each image had to be processed sequentially through four Sharcs to determine the top five classes. The processing for a particular target class was dependent on the results from the previously processed classes. This dependency enabled the algorithm to terminate earlier within a target class as more target classes were processed. As a result, each image could not be processed in the same order through the four Sharcs because the processing load was greater in the first Sharc than the latter Sharcs. As a result, the images had to be fed into the four Sharcs in a round robin fashion to balance the processing load. Although this approach complicated the distribution of the images in the processor, a 12 percent improvement in efficiency was obtained using this implementation.

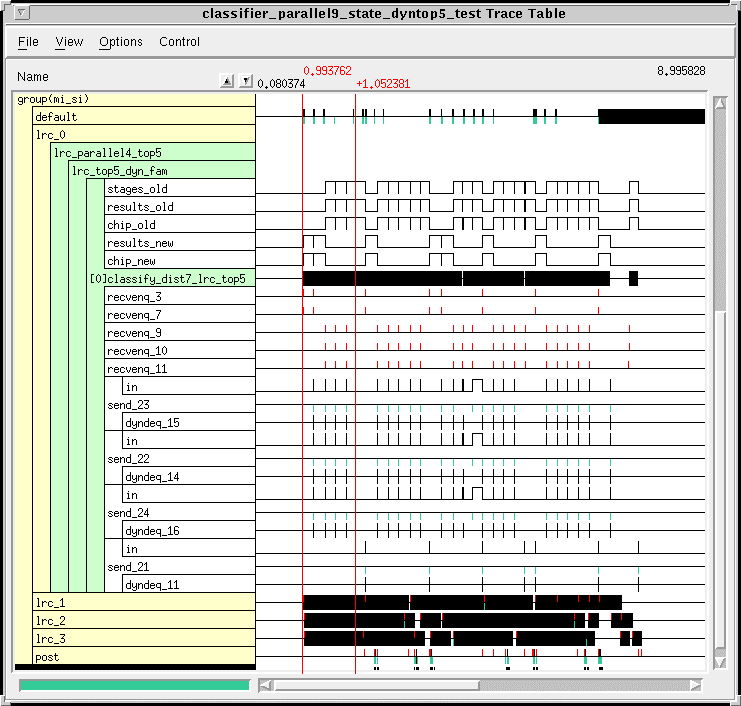
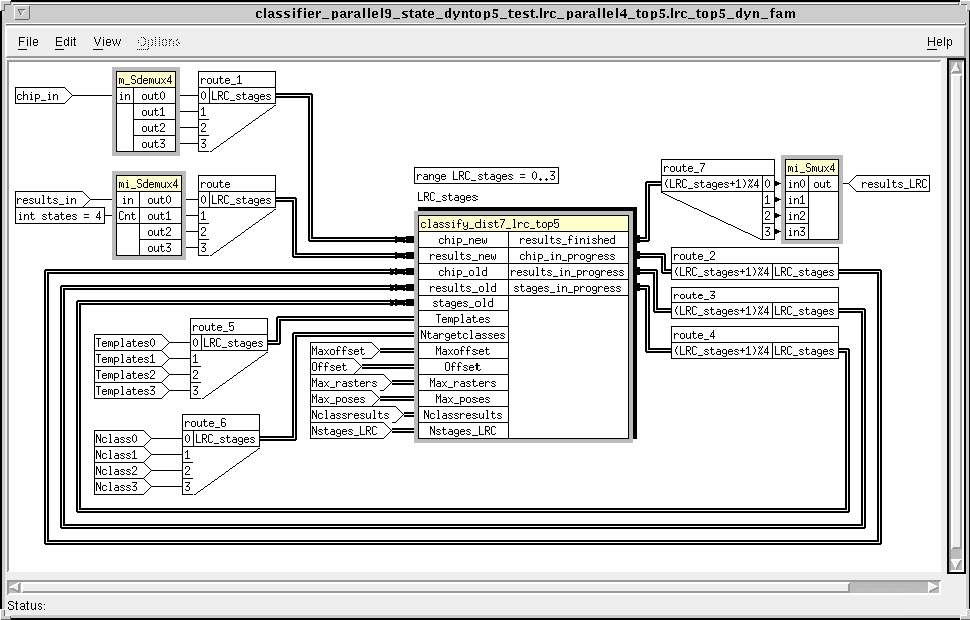
One of the key areas on this benchmark was to determine how well the GEDAE™ autocoding tools performed in generating the executable code for embedded processors. GEDAE™ is based upon a graphical paradigm to capture the data flow of the system. The data flow diagram (DFG) generated for the classifier with the algorithm distributed across four Sharcs is shown in Figure 4-1. As shown in this diagram, the distributed classifier received its input data from one of two possible sources. The first source input new images and an initialized results data structure (chip new and results new in Figure 4-1) into the four Sharcs in a round robin fashion. Note the GEDAE™ family notation was used for the distributed algorithm as the same algorithm was performed within all four Sharcs. The other source input data for images in progress from an adjacent Sharc (chip old, results old and stages old in Figure 4-1). Data queues were used on the input and output of each classification function to balance the processing load. The classifier attempts to process data from images in progress before processing new images. Once the processing was completed, the results are placed on the finished queue if the image has been processed in all four Sharcs or placed on the in progress queues if further processing is required.

Five images in the executable requirement were circulated in a round robin fashion and the processing timeline trace table for this algorithm running on 4 Sharcs is shown in Figure 4-2. The four classification functions, each running on a separate Sharc, are labeled lrc_0, lrc_1, lrc_2 and lrc_3 in this figure. The functional timeline for lrc_0 has been expanded to examine the behavior within one Sharc in more detail. The white gaps in the darkened timelines indicate periods of inactivity within a Sharc. Note the algorithm can not be implemented in a distributed fashion and keep all processors fully loaded as each processor uses a separate template set. It was expected that one of the processors would be fully occupied and set the basic computation rate. In this case, the Sharc performing the lrc_0 function was limiting the performance. The processing load would have been more balanced among the four processors if a more random set of input images had been used. However, the results in this case showed that a set of four Sharcs performing the first stage classification function could process 5 images per second on average. Thus, a total of 24 Sharcs were needed to meet the 30 images per second requirement. This implementation used one fewer Sharc than expected since the efficiency obtained after distributing the algorithm on multiple Sharcs was slightly better than expected.

3.3 Second Stage Classifier

The results from the first stage classifier were used to determine the subset of templates for the second stage. Since the complete second stage templates can not be stored locally in the Sharc performing the second stage algorithm, the templates must be passed as a part of the data flow. The key challenge in implementing the second stage was to have a single Sharc perform the following functions:

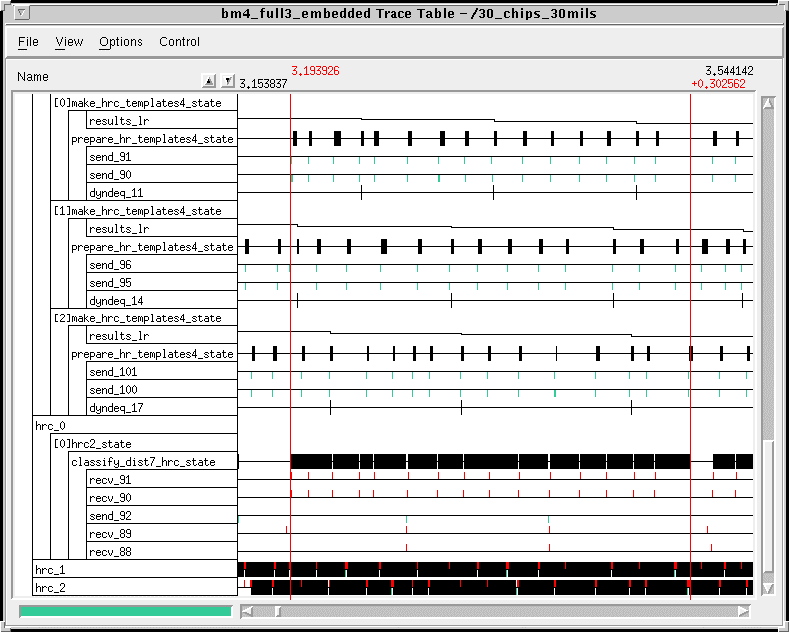
The cyclic state scheduling machine feature of GEDAE™ was used to implement the second stage classifier. With this approach, the templates for one target class were extracted and passed to the Sharc performing the classification algorithm. This process was repeated for the five target classes processed in the second stage. The second stage classification algorithm was not distributed over multiple Sharcs since the templates for one target class could be processed within a single Sharc. The processing timeline for the second stage classification algorithm operating on three images simultaneously is shown in Figure 4-3. This timeline shows a single processor can determine the template subsets of the second stage classifier for three images being processed simultaneously and distribute these templates to the three Sharcs performing the algorithm without impacting performance. Each Sharc performing the second stage classification algorithm can process approximately 10 images per second. Thus, four Sharcs were needed to perform the second stage algorithm to meet the 30 images per second throughput rate.

3.4 Summary of Detailed Design Activities

The detailed data flow (DFG) graphs for the MSE classifier were developed and validated during this phase. GEDAE™ was used to capture the DFG and generate all the executable code for the embedded processors. The significant challenge in developing the code was to effectively distribute the algorithm over multiple processors. The initial classifier DFGs that executed on a workstation were developed in only a couple of days by an engineer with no previous GEDAE™ experience. Once the original flow graphs were developed, the effort to generate the final executable code for the embedded processors was delayed by efforts to port the additional GEDAE™ functionality needed for the HDI algorithm on the Alex hardware. However, after this delay the GEDAE™ tool proved to be effective. In addition, the embedded classifier code generated by GEDAE™ exceeded the original performance estimate as only 28 Sharcs were needed to meet the requirements, instead of the 30 Sharcs as originally estimated.

4.0 Summary

The classifier was efficiently implemented on two Alex DSP boards using ADSP-21060 Sharc processors. This implementation was possible because of optimizations made throughout the design. The early termination algorithmic enhancements reduced the original 2.9 Gflops per second processing requirement to 1.1 Gflops per second. Rasterizing the template files and using the Sharc’s short word format to store the templates reduced the original 16.7 Mbytes memory requirement for template storage to 3.1 Mbytes. The assembly code was optimized which reduced the number of cycles needed to MSE computation from 13.8 cycles to 3 cycles. A Sharc processing efficiency (intrinsic rate divided by peak rate) of 33 percent was achieved using these optimizations. A GEDAE™ DFG was developed which implemented the classifier over multiple processors. This distributed implementation kept the processors active at more than a 95 % utilization rate (time that a processor is actively processing and not waiting for data).

Figure 4-1: Data Flow Diagram for First Stage Classifier

Figure 4-2:Timeline for First Stage Classifier

Figure 4-3: Timeline for Second Stage Classifier

Approved for Public Release; Distribution Unlimited Bill Ealy